.....India Holds Firm: Domestic Momentum Builds
FinTech BizNews Service
Mumbai, 25 August, 2026: PL Asset Management, the asset management arm of PL Capital Group, has released its PMS Monthly Newsletter for July 2026, reporting that India's domestic fundamentals — earnings, credit growth and institutional flows — held firm through the month even as a reignited Iran-linked conflict kept oil prices elevated and tested risk appetite across global markets.
July was shaped by a fraying Iran ceasefire and renewed disruption in the Strait of Hormuz. A May memorandum that had briefly restored tanker traffic collapsed during the month; renewed attacks on vessels and a resumed US blockade pushed transit volumes back toward war-time lows, keeping Brent crude in a wide $80–$120 band it has held since the March strikes. US core inflation, however, came in subdued — July core CPI rose just 0.2% month-on-month and 2.5% year-on-year, matching the slowest annual pace since March 2021 — leading markets to pare bets on near-term Fed action ahead of Fed Chair Kevin Warsh's remarks at the Jackson Hole symposium.
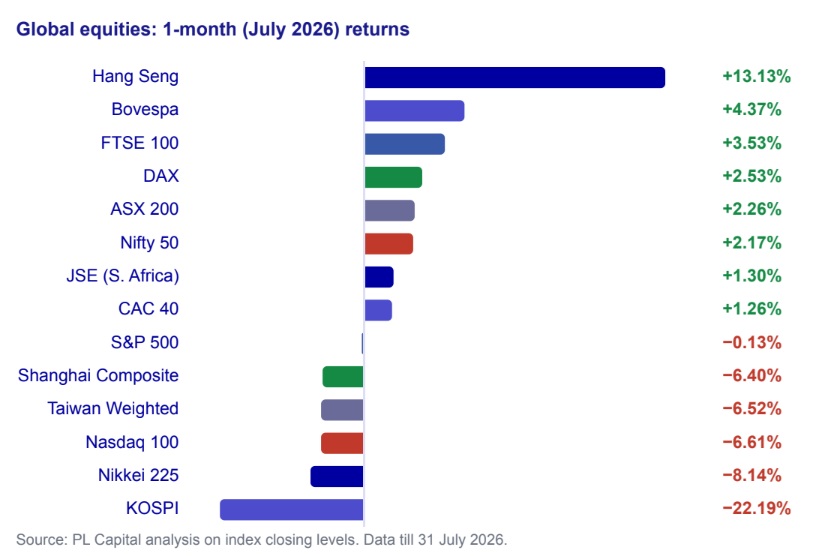
Global equity markets diverged sharply in response. The Hang Seng rose 13.13% in July while the KOSPI fell 22.19%, the Nasdaq 100 declined 6.61% and the Nikkei 225 dropped 8.14% — a broad unwind of the AI- and semiconductor-led trade that had powered several Asian markets earlier in the year. The Nifty 50 gained 2.17% over the same month, closing July at 24,383.60 with the rupee at 95.42 to the dollar, as India's domestic fundamentals held their ground against a volatile external backdrop.
Index | 1-Month Return (July 2026) |
Hang Seng | +13.13% |
Bovespa | +4.37% |
FTSE 100 | +3.53% |
DAX | +2.53% |
ASX 200 | +2.26% |
Nifty 50 | +2.17% |
JSE (South Africa) | +1.30% |
CAC 40 | +1.26% |
S&P 500 | −0.13% |
Shanghai Composite | −6.40% |
Taiwan Weighted | −6.52% |
Nasdaq 100 | −6.61% |
Nikkei 225 | −8.14% |
KOSPI | −22.19% |
Source: PL Capital analysis on index closing levels. Data till 31 July 2026.
Domestic Buying Streak Extends as Foreign Flows Begin to Turn
Domestic institutional investors — mutual funds, insurers and pension funds — extended their net buying streak to 37 consecutive months in July, the longest such run in data going back to 2007, continuing to absorb foreign selling through the month. Foreign investors showed the clearest signs yet of returning: financial-services shares drew renewed FII buying that reversed more than $12 billion of prior outflows, alongside a record inflow into index-eligible government securities, with banking stocks recording their strongest fortnightly inflow in over a year. India also reclaimed its rank as the world's fifth-largest stock market.
Beneath the headline numbers, the ownership picture looks healthier still: the number of stocks with foreign holding above 1% has broadened from roughly 900 to 1,300 over four years, even as aggregate foreign ownership declined — consistent with a rotation and broadening of exposure rather than a wholesale retreat, with foreign ownership as a share of the market sitting near a multi-year low.
Earnings Acceleration Confirms the Growth Story
Corporate earnings accelerated sharply in the first quarter of FY27. Median EPS growth across the listed universe jumped to 24% year-on-year, up from just 6% in the prior quarter, with sales, operating profit and PAT growth all moving higher together rather than a single metric driving the number. Industrial production also hit its fastest pace in nearly two years, with capital-goods output and electrical equipment as the standout categories — pointing to an investment-led recovery rather than a consumption-only story.
Index | Sales Growth (YoY) | EPS Growth (YoY) | P/E | PEG |
Nifty 50 | 14.6% | 15.0% | 20.8x | 1.39 |
Nifty Midcap 150 | 17.5% | 24.2% | 30.4x | 1.26 |
Nifty Smallcap 250 | 17.0% | 23.6% | 34.3x | 1.45 |
Figures are medians (equal-weighted), not capitalisation-weighted index arithmetic; the year-ago base was unusually soft, which flatters growth rates somewhat. Source: client-supplied internal earnings database, as at 2 August 2026.
Macroeconomic Indicators Remain Supportive
7.3% IIP (Jun-26) vs ~5.5% 5Y avg. | 17.7% Bank Credit (Jul-26) vs ~11.5% 5Y avg. | 15.4% GST Collections (Jul-26) vs ~10.0% 5Y avg. | 18.6x Nifty Fwd P/E (FY27E) vs 22.1x 5Y avg. |
Three independent data series are running well ahead of their trailing five-year averages at once — a broader signal than any single print. Industrial output (IIP) grew 7.3% in June, against a trailing five-year average of approximately 5.5%. Bank credit expanded 17.7% in July, against an average near 11.5%. GST collections rose 15.4%, touching a 14-month high against a roughly 10.0% average. On the policy side, India's 10-year government bond yield eased to 6.77% following a benign July inflation print, backing the Reserve Bank of India's fourth consecutive rate hold at 5.25%; RBI Governor Malhotra flagged inflation likely peaking near 5% in the December quarter but signalled no urgency to act.
The Valuation Angle — India’s Premium Looks Earned, Not Borrowed
Nifty trades at a trailing P/E of 20.78x, already below its own five-year average of 22.1x; on FY27E earnings, assuming 12% growth and no re-rating, the forward multiple falls further to roughly 18.6x. India’s listed market capitalization stands at approximately 120% of GDP against a 10-year average near 104% — a deviation of about 15 percentage points. Viewed alongside global peers, however, India’s premium looks moderate: South Korea’s market cap-to-GDP ratio (253% versus a 95% 10-year average) has run more than ten times further above its own history, driven by a narrow AI and semiconductor re-rating rather than broad earnings growth, while China has drifted up by a similar margin to India but with markedly slower GDP growth behind it.
Market | Current | 10-Year Avg. | Deviation | 2026E Real GDP Growth |
India ✓ | 120% | 104% | +15pp | 6.5% |
South Korea | 253% | 95% | +159pp | 1.9% |
Taiwan | ~518%* | 205.8% | +312pp | 5.2% |
China | 83% | 66% | +17pp | 4.4% |
Brazil | 41% | 46% | −5pp | 1.9% |
Market cap-to-GDP; *Taiwan’s ratio is inflated by globally-earned semiconductor revenue sitting against a small domestic GDP base and is not directly comparable. Source: PL Capital analysis; NSE, MSCI ACWI and consensus GDP estimates, as per latest data available (31 July 2026).
FUND MANAGER’S PERSPECTIVE
Siddharth Vora, Head – Quant Investment Strategies & Fund Manager, PL Asset Management
India’s Pivot: From Relative Defence to Earnings Confirmation
“We believe India is moving from a period of relative defence to an earnings-confirmation phase. The concentration trade-off that shaped last month’s thesis is now being overtaken by a stronger, more assertive signal: Q1FY27 median EPS growth jumped to 24% from 6% the prior quarter, with sales, operating profit and PAT all accelerating together, not just one metric moving.
The geopolitical backdrop has also moved on. The Iran ceasefire has frayed and the Strait of Hormuz has choked up again, keeping Brent in a wide $80–$120 band since March.
On flows, foreign investors have started coming back. July brought a record inflow into index-eligible G-Secs alongside renewed buying in financial-services shares that reversed over $12 billion of prior outflows, with banking stocks drawing their strongest fortnightly inflow in over a year. It is early days after a long stretch of foreign selling, so we are watching this closely rather than treating it as a confirmed trend, but the direction is now aligned with the domestic side: DIIs have bought for 37 straight months, the longest streak since 2007, and that flow has kept absorbing whatever foreign selling has shown up.
Three conditions are now aligning: earnings are confirming the growth call, with EPS growth of 6% to 24% quarter-on-quarter rather than an isolated beat; foreign flows are turning, with a record G-Sec inflow and renewed financials buying reversing over $12 billion of prior outflows, alongside a 37-month domestic buying streak that continues to provide a floor; and valuation offers support rather than a stretch, with Nifty’s forward P/E of 18.6x sitting below both its trailing multiple and its own five-year average, even as market cap-to-GDP runs a little rich against history.
Bottom line: across growth, valuations, and both domestic and foreign flows, India looks better placed than it has in months, provided the earnings acceleration holds through the next couple of quarters and the Hormuz situation does not escalate further.”
— Siddharth Vora, Head – Quant Investment Strategies & Fund Manager, PL Asset Management
OUTLOOK
India’s Setup Improves as Growth, Flows and Valuation Align
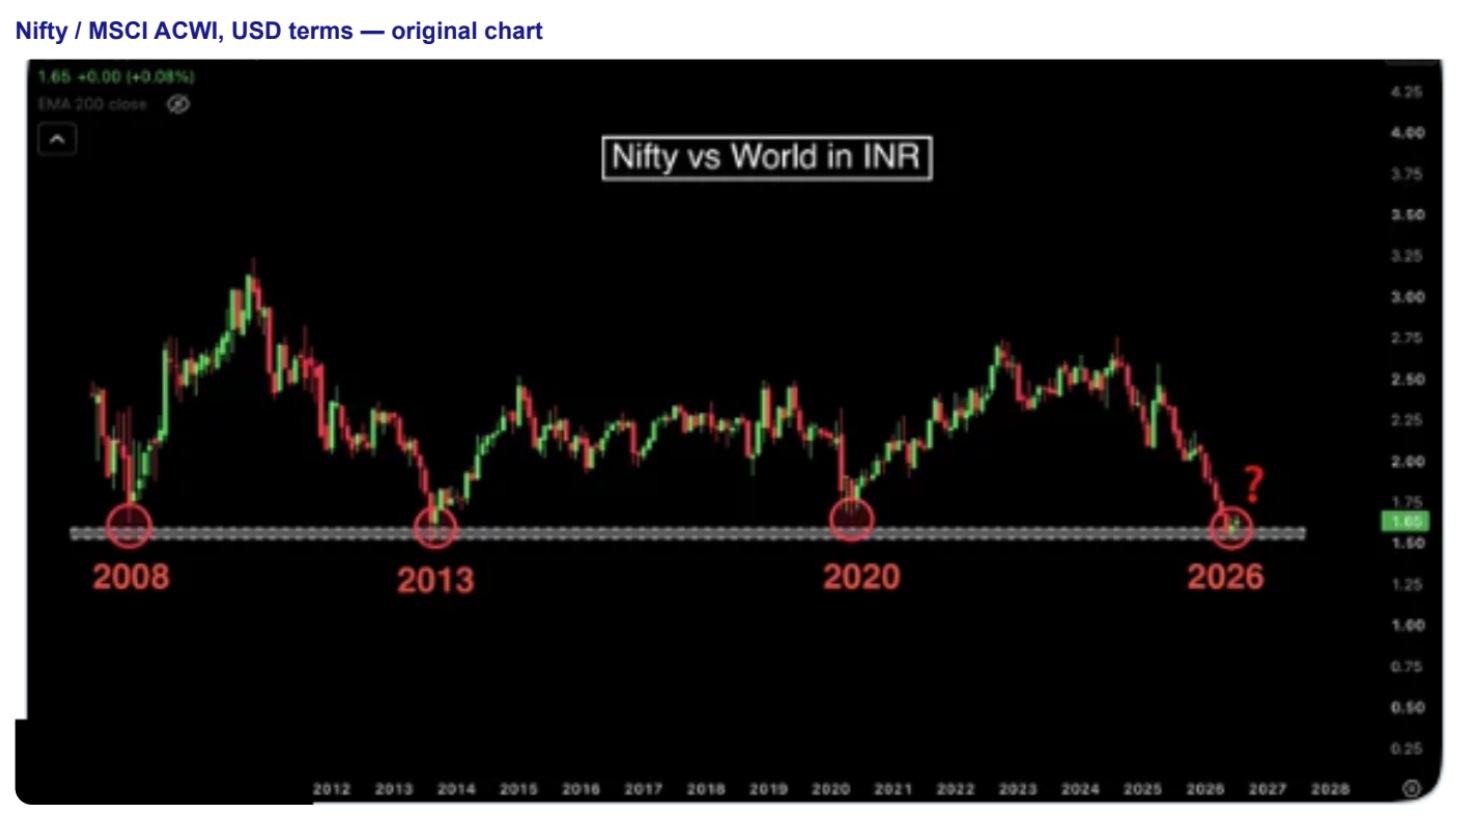
PL Asset Management remains constructive on Indian equities over the medium to long term. Industrial output and credit are running at multi-year highs, and earnings growth has accelerated from near-zero to 24% in the latest quarter. While Nifty has underperformed global equities sharply in dollar terms — the Nifty/MSCI ACWI ratio near 1.65, its lowest in the series — this reflects a currency and global mega-cap story more than a domestic one.
Domestic investors have now bought for 37 straight months, and foreign investors are showing early signs of turning too, with a record G-Sec inflow and renewed financials buying reversing over $12 billion of prior outflows. Valuation remains reasonable on Nifty’s own multiple — 18.6x forward — even if the broader market cap-to-GDP ratio, at 120% against a 104% average, is running a little rich, though less so than most peers once growth is accounted for.
The main swing factors ahead remain external — oil, the currency, and whether earnings momentum holds through the next couple of quarters — rather than anything domestic breaking down. The firm continues to favour opportunities linked to domestic consumption, financials, industrials and select mid- and small-cap businesses positioned to benefit from India’s next phase of growth, while monitoring the Hormuz situation and crude oil for any sustained move that could revive inflation and currency pressure.
