India’s real estate industry is expected to contribute more than 15% to India’s GDP by 2047, from 7% share currently
Jahnavi Prabhakar,
Economist,
Bank of Baroda
Mumbai, July 8, 2024: Here is a study which tests for whether we can use stamp duty collections in various states as an indicator of the real estate sector. The study looks at three aspects: collections by states, changes in stamp duty by states and housing price index; and concludes that this metric is a good proxy for the sector.
Given that the Indian economy is poised to grow at a strong pace in the coming years the real estate sector is expected to play a pivotal role in this story by providing a substantial boost to infrastructure.
The market size of the sector is likely to expand by US$ 1 tn by the year 2030. The study explores the relation of stamp duty collections by states for real estate activity in general in the last 10 years.
Additionally, price movements during this period are analyzed to gauge the effect of the increase in real estate prices.
India’s real estate industry is expected to contribute more than 15% to India’s GDP by 2047, from 7% share currently. There has also been a steady rise in the sales of upscale property signaling rising income, premiumization and pent up demand. This has been supplemented by the push given by the government to affordable housing through subsidies which has stabilized demand at the lower end of the price scale.
There are various factors that determine the demand of the sector, such as migration, prices, location, interest rates, rentals etc. Higher revenue receipts by state government through the stamp duty collection has been one of the high frequency indicators that sheds some light on how the housing market is faring. However, there are some caveats that needs to be taken in to account when looking at this variable.
Stamp duty is paid for both primary, secondary purchases as also for rental/lease agreements. Also, it is not possible to distinguish between residential and commercial transactions.
In addition, these rates have changed over the years across states and vary on the value of the property.
Higher collections by states would also be due to higher value of the houses/property being transacted.
Hence, while interpreting the results based on stamp duty collections, caution needs to be exercised as all these factors have been at play in varying degrees.
Stamp duty collections from property registrations have grown at a steady pace over the years. The total stamp duty collection across the sample of 23 states considered here for the last 10-years stand at Rs 13.7 tn. The top 5-states that have contributed the most to this collection, includes Maharashtra with a share of 23.4%, followed by Uttar Pradesh at 13%, Tamil Nadu (9.2%), Karnataka (8.4%) and Gujarat (6.7%).
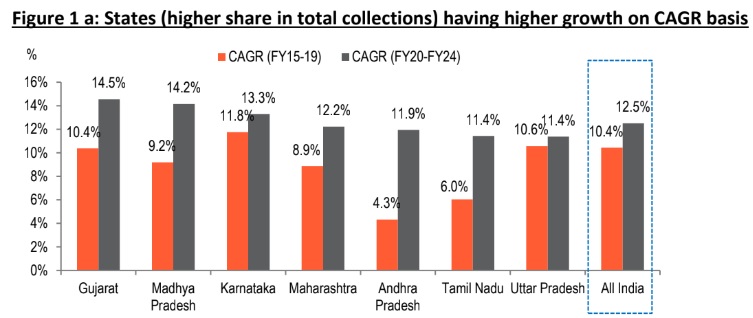
In this study, dataset for last 10-year has been taken and divided equally in 2-parts ranging between the years FY15 to FY19 and between FY20 to FY24 across all the states. All India (aggregate) has recorded a sharp increase in CAGR growth from 10.4% in the first quinquennium to 12.5% in the last 5-years, signaling much higher demand during this period. It has been noted, out of the 23-states, 16 of them have registered a higher CAGR growth in the last 5-years compared with the previous period.
States like Maharashtra have clocked double digit growth with a CAGR of 12.2% for the period between FY20 to FY24 compared with a CAGR growth of 8.9% during the period FY15 to FY19. Cities like Mumbai have played a pivotal role in contributing towards the same, as has been noted by real estate consultants like Knight Frank.
For the last year itself, there has been significant advancement in property registrations, with residential units contributing the most.
Notably the stamp duty rate in the last 10-years has changed substantially for the state, including a reduction in rate announced during the Covid-19 period back in Dec’20. This propelled the demand for housing sector in the state and drove up the registrations during the said timeline. However, later with the normalization, the reduction in stamp duty rate was withdrawn. Currently, the rise in stamp
duty collection due to higher property registration has been attributed to pick up in income level and growing interest towards the homeownership. Furthermore, property with higher value continue to grow at a steady pace.
In the last 5-years, CAGR growth of these 5-states namely Telangana, Bihar, West Bengal, Haryana, Odisha and Meghalaya have witnessed gradual moderation in their stamp duty collections reflecting possibly a slowdown in the demand of real estate in these states.
The CAGR growth in terms of stamp duty has come down to 2.9% for West Bengal, raising some concern over the demand for realty sector. However, given the recent rebate on stamp duty that has been further extended, it is expected to boost the demand for the sector.
In the context of stamp duty collections by the states, an important factor to analyze is the stamp duty structure in these regions. The absolute level of rates as well as changes over time would provide some insights on how the policy rates have impacted stamp duty collections.
The purpose of presenting the average stamp duty rate is only to show how they vary across states. Data have been collected from different sources and hence the definitions would differ.
Therefore, they are at best indicative of rates prevalent in the states.
As can be seen there is considerable variation across states with the rate varying from 4% to 8% (if Meghalaya is excluded). Also while some states have lowered the rates over this period, other have raised them.
A significant reduction can be seen for Uttar Pradesh and Chhattisgarh. It also came down for Mizoram, Odisha, West Bengal and MP.
Kerala and Assam have increased the rate by 200 bps. Other states where rates have gone up are Punjab, Maharashtra, Haryana, Telangana, Andhra Pradesh, Gujarat and Sikkim.
States where the rates remained unchanged are Jharkhand, Uttarakhand, Tripura, Bihar, Tamil Nadu and Meghalaya.
Hence these actions would also contribute to the quantum of increase in stamp duty collections.
Housing price Index: NHB
The NHB’s 50-city composite HPI (Housing Price Index) comprising over 20-states sheds light on price variation across properties and is based on the information collected through the housing finance companies and banks. The HPI based on the assessment prices differs remarkably across cities and has changed vastly in the span of last 10-years, with certain cities registering much higher price rise compared to others.
Out of 50 cities, 21 have registered a higher CAGR increase in the HPI in FY20-24 period compared with CAGR of FY15-19. Price appreciation with much higher CAGR growth has been witnessed across 4 major metros in last 5-years, including Ahmedabad, Hyderabad, Kolkata and New Delhi. In the past
10-years, average increase for the HPI is highest in two metros (Ahmedabad and Hyderabad) at 8.7% each and lowest for New Delhi (-0.6%).
Ahmedabad:
The metro has clocked significant double digit growth in the last 5-years. The CAGR growth for the metro has risen to 11.5% during the period, FY20-24 compared with a growth of 5.6% in FY15-19. In the coming years, the real estate market in the city is expected to benefit with the close proximity to the GIFT city and will register higher prices in the future, with the growing interest from investors.
Bangalore:
In the span of last 10-years, the metro has witnessed steady price appreciation. However, the CAGR growth in the last 5-year has moderated down to 5.1% from the growth of 7.2% registered back in FY15-20 period. However, the residential real estate market is expected to pick up. This can be attributed to the demand expansion led by growing job opportunities, status of technology hub and supported by infra development, thereby attracting investor attention.
Mumbai
The city has registered gradual pace of moderation with CAGR growth in housing prices down to 1.9% for the time frame FY20-24. One of the reasons for slower pace of price rise is possibly due to oversupply, especially in the redevelopment market. Post the pandemic, the housing demand had expanded and this resulted in a jump in launches in the micro-markets, which has stabilized now.
However, the housing demand continues to be strong and prices are expected to edge up once again in the near term. Pune too has witnessed similar movement, with price rising at a slower pace in the last 5-years (FY20-24) when compared with CGAR price growth in FY15-19.
Kolkata:
The real estate market has been witnessing a strong demand with the rapid expansion in urban areas, higher income level and growing transport linkages across the cities. This is also visible with steady pace of price appreciation in the metro with the CAGR growth last 5-years rising by 5.3% compared with a growth of 4.4% for FY15-19.
Conclusion:
Stamp duty collections of the government is a good indicator of the health of the real estate sector in India. Stamp duty rates have changed over time but tends to be very gradual and remains unchanged for a larger part of a time period. The prices of homes have grown at differential rates and also contribute to the collections. However, increase in HPI is always associated with the state of the real
estate market and hence it would be reasonable to conclude that higher collections associated with rising HPI does indicate a buoyant market.