Tax Filers Are Rising. Taxpayers Aren't; Income growth is deepening but not widening sufficiently

FinTech BizNews Service
Mumbai, 22 May 2026: The latest report from Kotak Mutual Fund on the changing Face of Consumption in India, makes interesting reading:
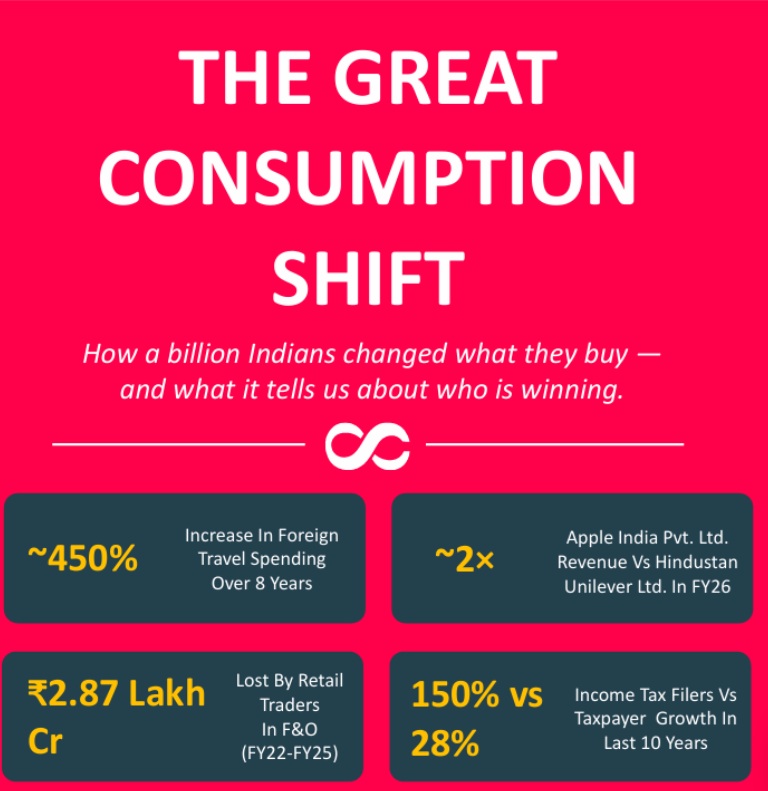
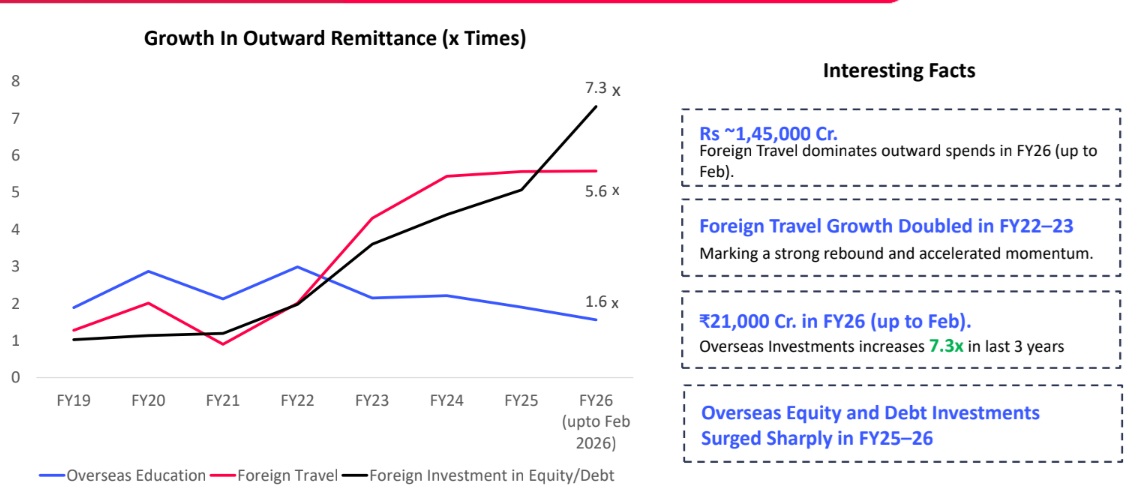
*India’s Rs1.45 lakh crore foreign travel spend in a year is larger than the entire building material industry* (plywood, tiles, pipes, and laminates)
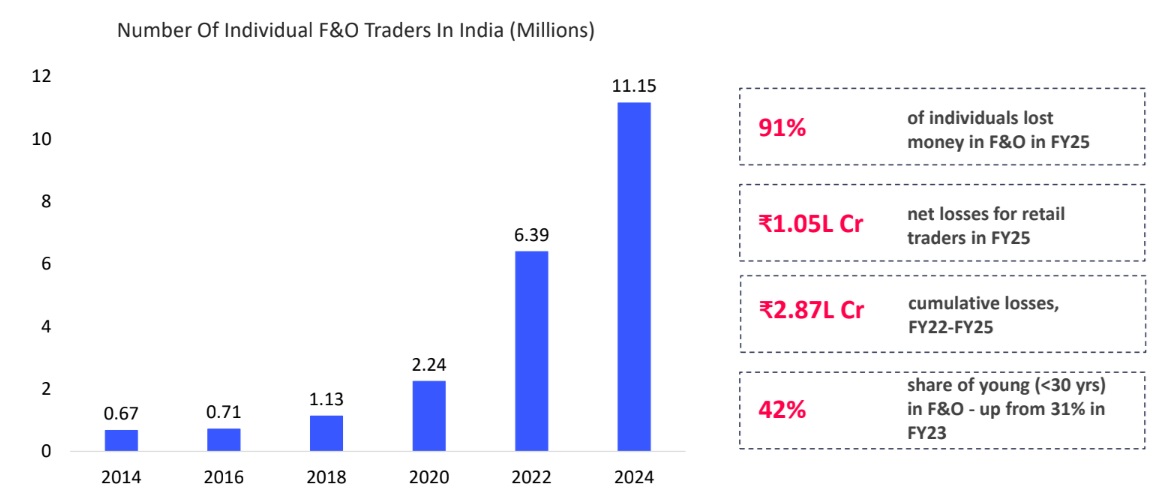
 The *Rs2.87 lakh crore lost by retail traders in FY22-25 is more than half of consumer staple spend in a year or it could have bought 35–36 crore washing machine*, nearly each household in India having one washing machine.
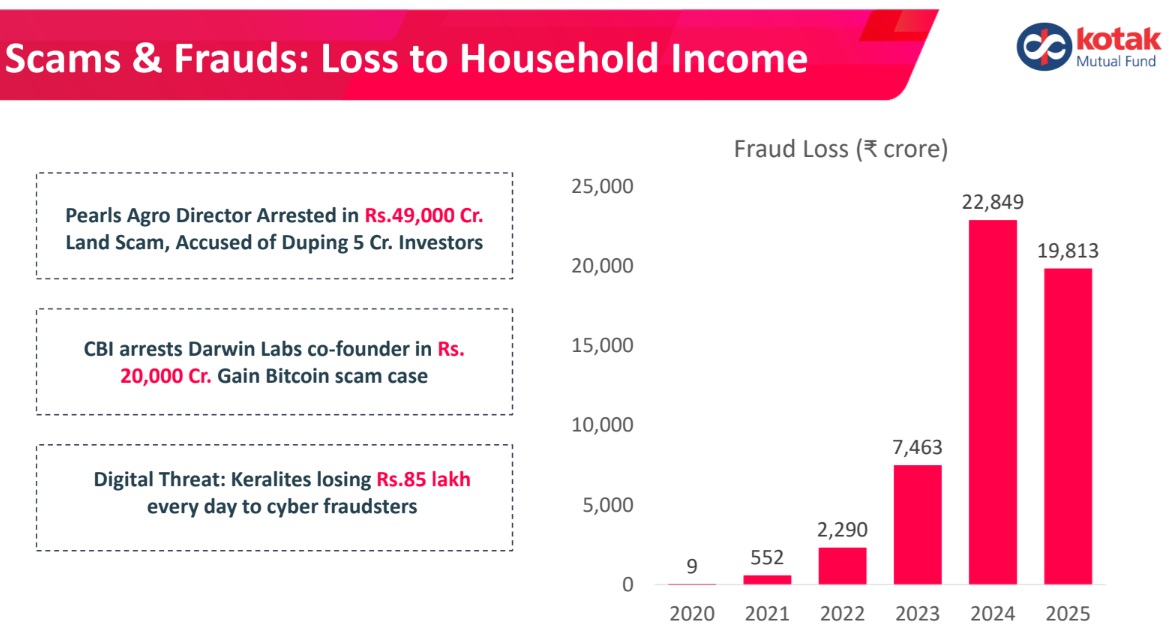
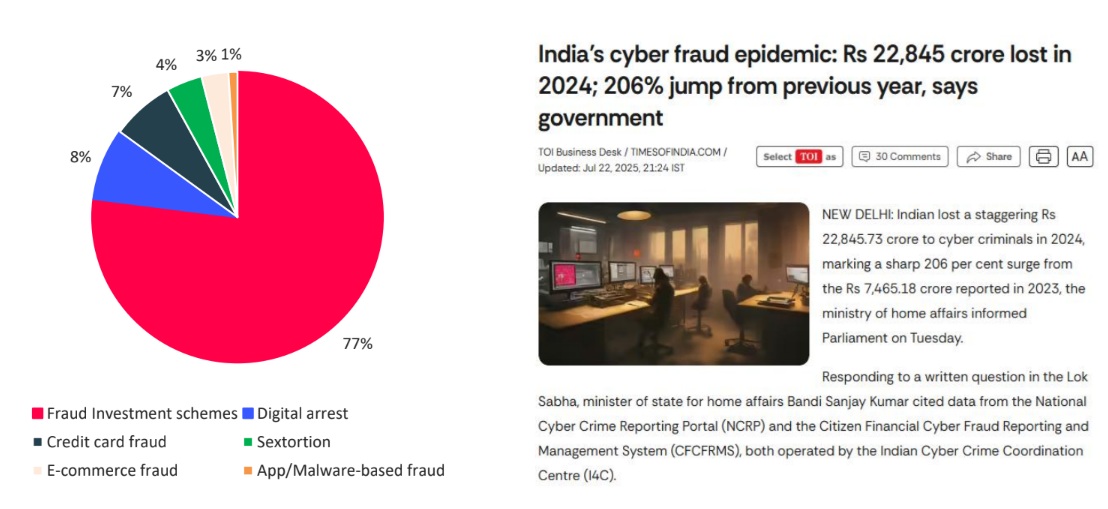
The *Rs53,000 crore lost in digital frauds in 6 years is equivalent to India’s branded QSR industry*, money literally shifting from consumption to scams.
 *Apple India added Rs1.2 lakh+ crore revenue in 5 years, almost equivalent to creating a two new HUL-sized business* almost from scratch.
 *India’s live events industry (Rs20,800 crore) is now comparable to the entire organized footwear market*, weekends are replacing wardrobes.
There are three distinct trends visible in India’s consumption basket
- *Indian wallet is shifting from cereals and pulses to data, OTT and mobile*
- *Income growth is deepening but not widening sufficiently*
- *speculative loss, digital fraud and Ponzi schemes if plugged can boost economy more than the GST cut announced in Sept 24.*
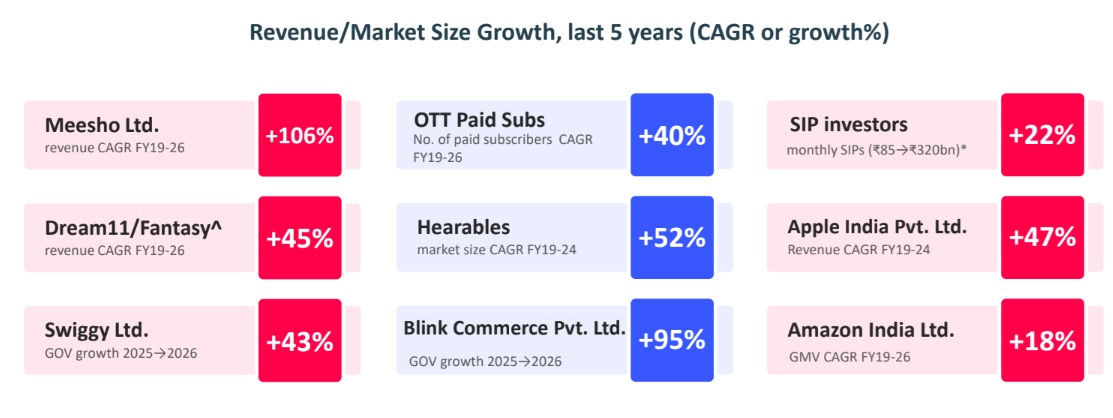
The New Categories India Is Buying
Revenue/Market Size Growth, last 5 years (CAGR or growth%)
Indian Household Isn't Really 'Spending On Food' Anymore
Share of food in monthly per-capita spend has collapsed in both rural and urban India, replaced by automobiles, mobile phones, eating out & rent
Within food, cereals fell from 22% to 5% rural / 12% to 4% urban. The thali shrank - the wallet expanded elsewhere.
The Categories That Got Bigger, And The Ones That Shrank
Change in share of urban household spend (1999-00 → 2022-23, percentage points)
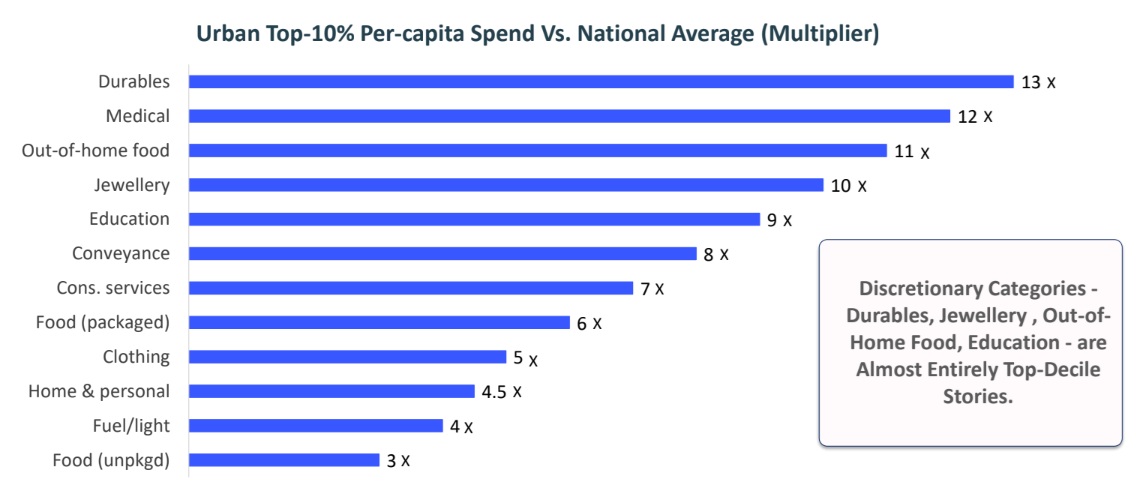
Consumption Skewed: Top 10% Urban India Spends
Multiples of the National Average
Urban Rent Went From a Footnote to a Real Item
Concerts. Premieres. The 'Going-out' Boom.
India’s Outward Wallet Shift to Foreign Spending
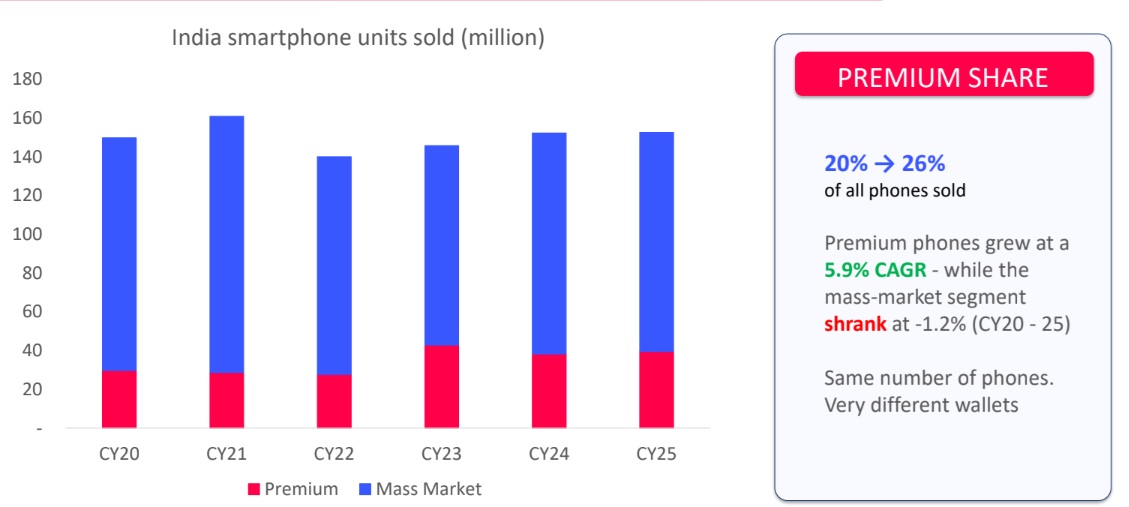
Total Phones Sold Flat. But The Premium Share Is Exploding
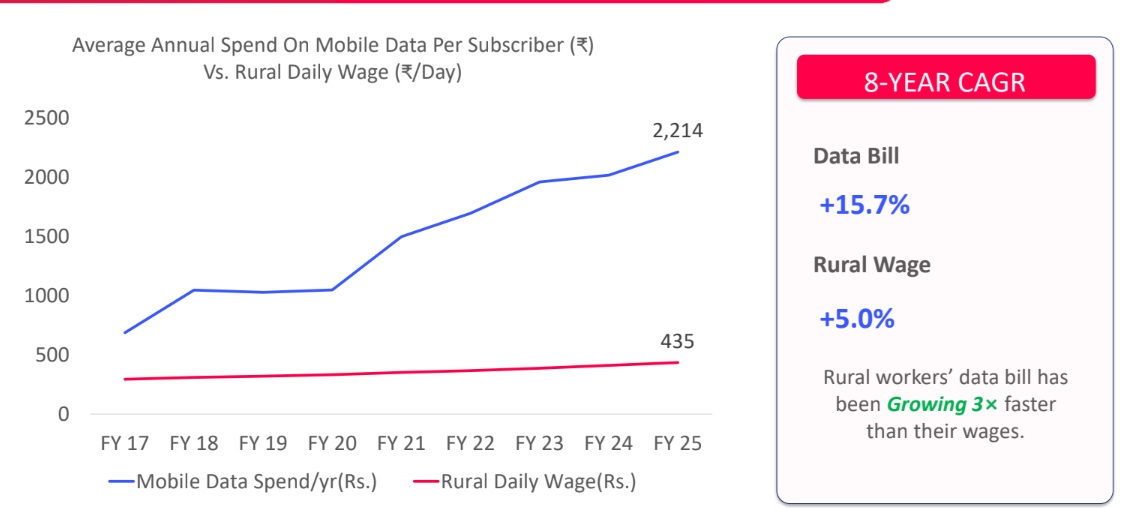
Your Monthly Data Bill Quietly Tripled
Urban Wealthy: 18% CAGR vs Urban Mass: 6% CAGR
Rural Wealthy: 10.1% CAGR vs Rural Non-Agri Labour: 7.2% CAGR
Tax Filers Are Rising. Taxpayers Aren't
Average Tax Paid Per Payer
Rs83K → Rs2.4L
Each payer paid 3× more.
FY13 → FY23.
India Vs World
Only 2% of Indians pay Income Tax.
China: 10% | USA: 43%
Loans Grew Faster Than The Salary That Pays Them
Over The Past 7 Years, EMI Burden Outpaced Salary Growth In 5 Years.
...Partly Impacting Household Net Savings
Speculation Loss And Fraud, Eating Into Consumption
The Retail Army Has Marched Into Derivatives - and Lost
Scams & Frauds: Loss to Household Income
Rs41,000 Cr Wiped Out: Investment Frauds Dominates The Pie
Key Trends & Insights
Wallet Share Shift
The Indian wallet has moved from cereal to data to OTT to mobiles. But the household behind it is saving less, paying more rent, and carrying more EMI. Apple India grew 6.2× while HUL grew 1.4× isn't a coincidence - it's the shape of demand. Foreign travel spending is up 5.6x in last 8 years.
Income growth deepened. It didn't widen.
Top urban cohorts (18% income CAGR) are growing faster than urban mass (6%) . Similarly, rural wealthy (10% income CAGR) is growing faster than rural non Agri labor (7.2% income CAGR).
Speculation loss and Fraud, eating into consumption.
Rs1.05 L crore lost in FY25 alone by individuals. 91% lose money. Rs 53000 crores is lost in digital frauds over past 6 years. Money once used for consumption is being transferred.