While DMF shareholding reached fresh all-time highs

Tirthankar Patnaik, PhD
Chief Economist
National Stock Exchange of India Limited (NSE)
Mumbai, May 30, 2024: This is the second part of the series on the May 2024 edition of the ‘Market Pulse’, published by NSE. In the monthly publication issued by the Economic Policy and Research (EPR) department of the National Stock Exchange of India, titled Market Pulse, a review of major developments in the economy and financial markets for the month gone by, is undertaken.
Listed universe ownership trends
Ownership pattern of the NSE-listed universe (March 2024)
Promoter share in NSE listed companies at five-quarter high: Total promoter ownership in the NSE listed universe rose by 67bps QoQ to 51.4% in the March quarter. With this fourth straight increase, aggregate promoter holding now stands 1.5pp higher than the March 2023 level, primarily driven by a surge in Government promoter shareholding to 10.7% (+1pp QoQ, +2.8 pp QoQ). Conversely, private Indian promoters’ stake in the broad market dipped by 39bps QoQ to a 17-quarter low of 32.7% (vs. 33.2% in Mar’23), while foreign promoter holdings remained largely unchanged on a sequential basis at near 43-quarter low of 8%.
Government ownership surged to seven-year highs:
After a steady decline between 2010 and 2022, thanks to Government’s efforts to garner higher revenues through the disinvestment route, Government ownership (promoter as well as non-promoter) in the NSE listed companies rose by a steep 2.4 percentage points (pp) in FY23, attributed to the listing of LIC during the year. The trend continued in FY24 as well, with the Government share in the listed universe rising by another 2.8pp—the highest annual increase in last 15 years—to a seven-year high of 11.2%. Notably, a percentage point out of the 2.8pp increase last year came in the March quarter alone. This was yet again driven by continued outperformance of PSUs relative to the broader market. For instance, the NIFTY PSE index generated a gain of 16.1% in the March quarter compared to the 2.7% and 4.3% returns recorded by Nifty50 and Nifty500 Index respectively.
FPI ownership dipped below 18% for the first time since 2012:
FPI shareholding declined for the fourth quarter in a row by 36bps QoQ to a 47-quarter low of 17.9% as of March 31st, 2024. This translated into a 125bps drop in FPI share in the fiscal year gone by, marking the fourth annual drop in a row. That said, FPIs’ portfolio still expanded by a steep 41% in absolute terms Rs 68.3 lakh crore in FY24. Notwithstanding strong foreign capital inflows last year, with FIIs investing nearly US$25.3bn on a net basis, the decline in FPI share is partly attributed to relative underperformance of the FPI-heavy financial sector (particularly private banks) in the quarter and the whole of last year. During the quarter gone by, while the Nifty50 and Nifty500 Index delivered returns of 2.7% and 4.3% respectively, Nifty Financial Services Index and Nifty Private Bank Index actually declined by 2.3% and 5.3% respectively. Excluding Financials, FPI share in the NSE listed universe inched up by a modest 29bps QoQ to 15.9%. …
While DMF shareholding reached fresh all-time highs: Continuing the steady upward trend witnessed over the previous two quarters, DMF share in the listed universe rose by 12bps QoQ to fresh all-time high of 8.9% as of the quarter ending March 2024. This marked the third annual increase in a row and corroborates with sustained buying by DMFs during this period. DMFs injected a net amount of Rs 2 lakh crore into Indian equities in the fiscal year gone by, taking total net inflows to Rs 5.3 lakh crore in the last three years. A part of this is attributed to rising indirect participation of individuals via the SIP route. SIP inflows have risen steadily in the fiscal year, with an average monthly run rate rising by 11% QoQ to Rs 19,099 crore in the March quarter. Average monthly SIP inflows in FY24 stood at Rs 16,602 crore, up 27.7% from Rs 12,297 crore recorded in the previous year. Out of the total DMF share of 8.9%, passive funds’ share remained steady at 1.7%, with the balance 7.2% held by active funds, up 11 bps QoQ.
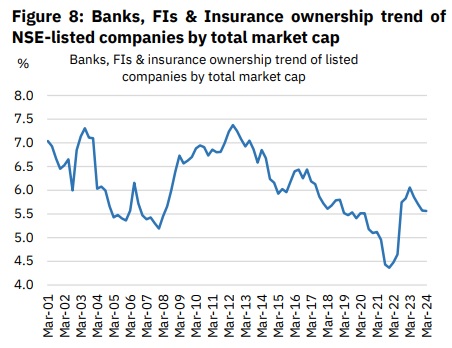
The share of Banks, Financial Institutions and Insurance companies in the NSE-listed space remained broadly unchanged on a sequential basis, ending the fiscal year at 5.6% (vs 6.1% in Mar’23).
Individual investors’ holding slipped in the last quarter:
After peaking at 9.7% in June and remaining largely unchanged in December, individual investors’ share of the total NSE listed universe dipped by 16bps QoQ to 9.5% at the end of the March quarter. This was in contrast to significant net investments by individual investors in the quarter gone by. Individuals injected a net amount of Rs 52,568 crore in the March quarter (NSE’s secondary markets only)—the highest in last nine quarters, as compared to net outflows of Rs 5,853 crore in the previous quarter, the highest in the last nine quarters. The drop was seen across the board, with all but two sectors (Real Estate and Utilities) witnessing a dip in individual ownership. Notwithstanding some moderation in direct investments into Indian equities last year, individuals—after adding their indirect ownership via mutual funds—now own a bigger share of the market as compared to FPIs after a gap of 18 years. This is a reflection of their growing role and significance in Indian equity markets.
Institutional ownership in NSE floating stock marginally inched up:
DMF ownership in the NSE floating stock inched up to a fresh all-time high of 18.4% in the March 2024 quarter, marking a full percentage point rise in the entire fiscal. On the other hand, FPI holding in the floating stock of the NSE listed universe dipped for the fourth consecutive quarter, standing at a 14-year low of 36.8%. FPI share in the NSE floating stock is now 8.9pp below the peak share seen eight years back (March 2014). This dip, however, was restricted to the biggest companies, as evidenced by a rise in FPI free float ownership in listed universe excluding 50 (+71bps to 29.6%) and excluding 500 (+ 1.4pp to 14.5%) companies. Banks, Financial Institutions and Insurance companies’ share in the free float of NSE-listed companies inched up marginally to 11.4% (+14bps QoQ). Overall institutional ownership of the NSE free float increased marginally by 10bps QoQ to 70.8%, 1.5pp below the all-time high of 72.3% (Mar’23). Individual investors’ ownership of the NSE free-float market cap remained largely unchanged at 19.6% in the March quarter. The share stands nearly 9.5% below the peak individual ownership level seen over the last 20 years.
Long-term ownership trend of the NSE-listed universe
Long-term trend shows a steady drop in promoter ownership during 2009-2019, followed by a marginal increase thereafter:
The long-term trend indicates a sharp rise in promoter ownership between 2001 and 2009 (To 19-year high of 57.6% in March 2009) that gradually tapered off since, coinciding with the SEBI’s decision to increase the minimum required free float from 10% to 25% in 2010. However, the drop has been primarily led by a sharp decline in Government ownership over the years, and strategically so, with the aim of expanding public partnership in the ownership of CPSEs (Central Public Sector Enterprises) and augmenting its resources for higher expenditure towards economic development. On the other hand, overall private promoter ownership—Indian and foreign promoters combined—has increased by ~11.6pp between June 2010 to December 2021. Promoter share, however, has been inching up since last few years barring FY23, primarily led by an increase in Government share.
Sharp rise in DMF ownership during 2014-19 supported by rising SIP inflows:
Barring a drop in FY21, DMF ownership has seen a sharp increase over the previous six fiscal years (FY15-FY23), largely reflecting the sustained retail interest in equity mutual funds as an investment channel through SIPs. Drop in DMF ownership in FY21 (Apr-Mar’21) had been largely on the back of moderation in SIP inflows as well as high redemption pressures, thanks to macroeconomic slowdown and attendant drop in disposable incomes that got accentuated by the COVID-19 outbreak. This partly found its way to Indian equities via higher direct retail investments, as visible from a steady increase in direct retail ownership during this period. With indirect participation by individual investors seeing a renewed jump beginning June 2021 via the SIP route, share of DMFs in the NSE listed universe has risen steadily to record-high levels. Banks, FIs & Insurance share, on the other hand, has been gradually dropping off since 2012, only to see a significant jump in FY23 (+158bps).
FPI ownership dropped to sub-18% in FY24 after more than 11 years:
FPI ownership in the NSE-listed space saw a gradual increase between 2002 and 2015, except for a brief period around the 2007-08 financial crisis, but dropped marginally over the subsequent three years, reflecting negative global cues including the US-China trade war and Brexit concerns. FPI share picked up over the next two years until December 2019 but fell sharply during the first two quarters of 2020 post the onset of the COVID-19 pandemic. This, however, was temporary as huge liquidity injection globally improved risk appetite, leading to a jump in FPI share in the second half. Since then, FPI share has been trending down, reflecting weakened investor sentiments in the wake of recurring COVID waves, China slowdown, Russia-Ukraine war, worsening growth-inflation dynamics, and rapid monetary tightening by global central banks, notably the US Fed. In fact, FPI share dropped to sub-18% by the last quarter of FY24 for the first time in more than 47 quarters.
Direct individual holding has remained between 8% to 10% for more than a decade now:
Not surprisingly, while individual investments through the SIP route has been rising over last few years, barring a steady drop in FY21, direct individual participation in equity markets remained quite stable—a sign of maturing markets and indirect ownership. Individual investors’ ownership of the NSE listed universe declined steadily between 2001 and 2012 but has since increased marginally.
(To be continued)
(This report is intended solely for information purposes. This report is under no circumstances intended to be used or considered as financial or investment advice, a recommendation or an offer to sell, or a solicitation of any offer to buy any securities or other form of financial asset. The Report has been prepared on best effort basis, relying upon information obtained from various sources. NSE does not guarantee the completeness, accuracy and/or timeliness of this report neither does NSE guarantee the accuracy or projections of future conditions from the use of this report or any information therein. In no event, NSE, or any of its officers, directors, employees, affiliates or other agents are responsible for any loss or damage arising out of this report. All investments are subject to risks, which should be considered prior to making any investments.)