Protection growth picks up, ULIP declining for most players; Underperformance of private insurance sector ignores improving trends
FinTech BizNews Service
Mumbai, 19 August, 2026: The latest Kotak Institutional Equities report on Insurance provides valuable insights for the various stakeholders:
Ignoring improving trends
The recent underperformance (7-15% over the past three months) of the private insurance sector ignores improving underlying performance. Private life companies fared well with an 8-33% VNB growth in 1QFY26 and moderate APE growth; margin expansion was driven by protection, improving leverage and favorable rate movements, despite the GST drag. Health insurance is holding on well, with the risk of higher TP losses looming on the multi-liners.
A strong 1Q is completely ignored
Life insurance companies reported 8-36% APE growth in 1QFY26. Growth in the traditional business was a bigger driver for most, with par and annuity taking over. More importantly, margin expansion was strong at ~200-300 bps (120 bps reported yoy decline for SBI Life due to high growth in group savings; nearly flat at HDFC Life), driven by high growth in individual term (up 19-57% yoy) and credit protect due to the revival of the MFI business. Favorable rate movement in 1Q (will partially reverse in 2Q) and improving leverage were drivers; what is commendable is that the margin expanded despite the drag of ITC loss due to a GST exemption. With commission guidelines being pushed out, we expect insurance companies to focus on growth and have a decent year.
LIC—running out of excuses to ignore
LIC’s stock has been ignored, trading at 0.6X EV FY2028E. While initial (post-IPO) concerns stemmed around the lack of ability to forecast unwinding, LIC now has four years, following the listing track record of 9% realized returns (unwinding + MTM). LIC has also started to gain APE momentum and more importantly, consistent margin expansion due to an increasing share of non-par. Overhang of OFS was another concern lately expressed by investors, which is also now behind us. Valuations remain screamingly attractive.
Non-life is getting healthier
Health insurance companies reported strong 1QFY27 performance, enjoying post-GST benefits; new business growth was up 37-41%. The combined ratio improved 160 bps for Star Health and 300 bps for Niva Bupa on the rundown of the loss-making/sub-optimal group business, pricing up benefits at Star Health and leverage benefits at Niva Bupa. On the other hand, non-life multi-liners remain under the overhang of higher claims in motor TP due to flat third-party tariffs, accentuated by the recent judgment on compensation to home makers.
Retain positive stance on life companies
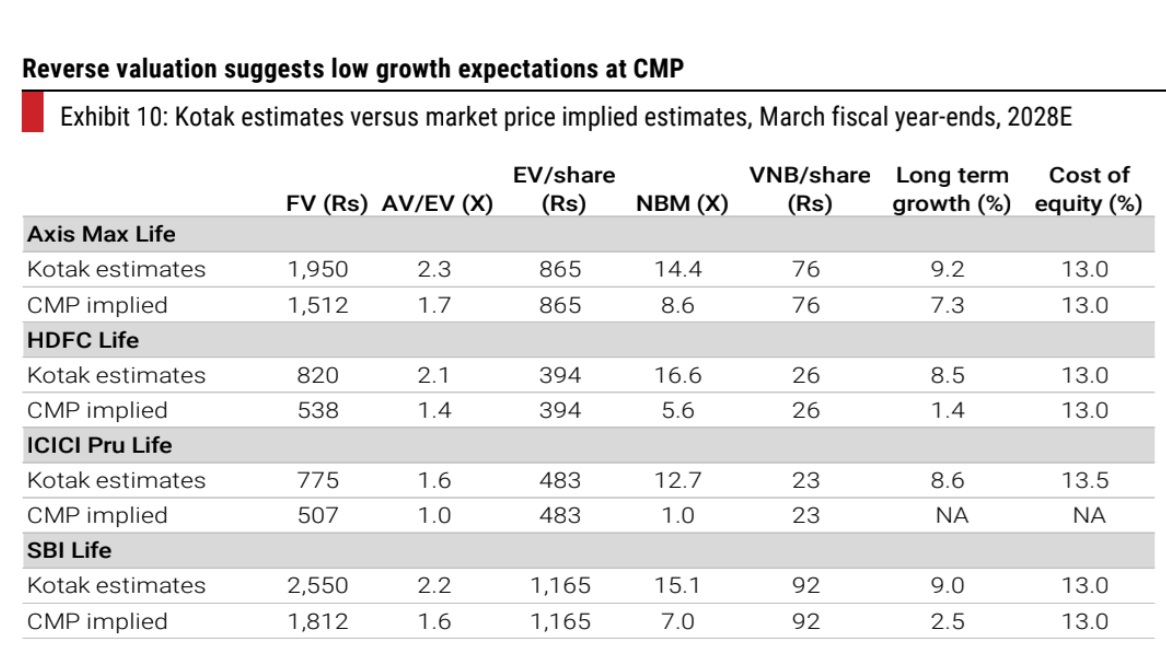
Overhang of regulations has weighed on life insurance stocks. The sector has been resilient to changes in regulations and taxation, recovering after a short period of realignment. The overhang of expected regulations on commission caps is heavily weighing on the stocks, leading to massive underperformance. A potential stake sale by Prudential and a purchase by Axis Bank are likely to weigh on the respective life companies. While we do not want to preempt commission regulations, valuations look attractive across the board, proving strong upsides for the patient.
Player-wise 1Q results summary:
4 | Aditya Birla Sun Life reported strong APE growth and improved margins. ABSLI reported a sharp 26% yoy growth in APE to Rs11.1 bn, while the VNB margin nearly doubled to 15.1% from 7.5% in 1QFY26, driving 153% yoy growth in VNB to Rs1.7 bn. Growth was led by partnership channels, which grew approximately 34% yoy, while proprietary channels declined 6% yoy. Management highlighted the continued scale-up across its 11 bank partners, rising mindshare in larger banks and further growth headroom at Axis Bank. The product mix shifted favorably toward annuity and protection products, which grew 219% and 50% yoy, respectively. Margin expansion was supported by a controlled ULIP mix, a higher share of protection and annuity products, improved channel productivity with roughly half of the incremental APE generated without additional costs and healthy rider attachment, which contributed approximately 150-200 bps to the margin improvement. |
4 | Axis Max Life sustained strong momentum. Axis Max Life reported strong 33% yoy growth in VNB, ahead of our estimate of 12% and the 9-30% growth reported by private peers. APE grew 15% yoy, marginally below our estimate of 18% versus 9-36% growth for peers, while the company recorded a modest market share gain in 1QFY27. Margin expanded over 300 bps yoy, driven by a higher share of the protection business, which grew 57% yoy to 15% of APE, with individual protection growing 44% yoy. Higher operating leverage and changes in interest rates also supported margin expansion. |
4 | Bajaj Life transformation rolling out smoothly. Bajaj Life Insurance reported a sharp 87% yoy growth in VNB in 1QFY27, reflecting the benefits of its transformation program. APE grew strongly by 30% yoy, supported by 17% growth in the individual business and a push toward group protection and savings products. The VNB margin expanded 480 bps yoy to 15.9% after the GST reset, while the pre-GST reset expansion was approximately 700 bps. The underlying margin improvement was driven by strong growth in individual term insurance, which increased 57% yoy and accounted for 12% of individual APE, along with higher rider attachment, a favorable shift in the savings mix and improving operating leverage. |
4 | HDFC Life reported weak growth and margin pressure. HDFC Life’s headline print was weak with 9% VNB growth in 1QFY27 on the back of similar APE growth, marred by muted growth (6%) in savings. While the bancassurance business was weak (up 2% yoy) due to a slowdown at the parent bank, the rest of the business fared well with 17% yoy growth. We expect improvement in traction at HDFC Bank over the next few months; this will increase HDFC Life’s overall momentum to gain market share over the rest of the year. |
4 | ICICI Prudential Life reported strong VNB growth, led by protection; savings remained subdued. ICICI Prudential Life reported 25% yoy growth in VNB, 9% ahead of our estimate, largely driven by 46% growth in protection APE. VNB margin expanded to 26.7% from 24.5% in 1QFY26. Individual protection APE grew 60% yoy, sustaining the strong momentum seen in 4QFY26, while group protection grew 38% yoy as momentum in the microfinance business improved. We expect retail protection momentum to continue over the next two quarters, with a longer growth runway for group protection. However, savings APE grew only 6% yoy, with the non-par business remaining weak amid competition from elevated fixed-deposit rates. ULIP growth will remain linked to capital market trends, while annuity, largely comprising regular-premium products, has scaled up to 32% of APE. |
4 | LIC reported strong VNB growth and sharp margin expansion. LIC reported 61% yoy growth in VNB, 11.9% ahead of our estimate, supported by 8% APE growth and a 754 bps yoy expansion in VNB margin to 22.9%. APE growth based on Life Insurance Council disclosures was higher at 15%, with the difference reflecting the impact of monthly-payment policies, which is not uncommon across the sector. Margin expansion was driven by the strategic shift from par to non-par products, with non-par savings APE growing 59% yoy to 9.4% of overall APE. The estimated segmental margin for non-par products, including ULIPs, increased approximately 1,400 bps from FY2026 to 63.2%, compared with 12% for par products and 15% for the group business. Management remains confident of narrowing the margin gap with private peers, which operate at approximately 25% over the medium term. We conservatively factor in flat margins and mid-single-digit APE growth, with downside risks from adverse movements across the yield curve, weaker persistency and potential business disruption from the proposed commission guidelines. |
4 | SBI Life reported strong VNB growth. SBI Life reported 30% yoy growth in VNB to Rs14.1 bn, 18% ahead of our estimate, while the reported VNB margin of 26.2% was 20 bps below our estimate. APE grew 36% yoy, significantly ahead of our estimate of 14% and the 16% growth reported by the Life Insurance Council, with the difference largely attributable to strong group-term growth classified by SBI Life as regular-premium business. Given the typically low margins in group business, our back-of-the-envelope calculation suggests that the margin for the rest of the portfolio was considerably higher at 28-30%, supported by a favorable product mix. Non-par products accounted for 21% of APE and grew 24% yoy, while individual protection APE increased 19% yoy to 3.5% of overall APE. Within protection, the share of relatively lower-margin return-of-premium policies declined to 68% from 73% in 1QFY26, while pure individual protection grew strongly by 41% yoy. Reported margins also absorbed the impact of the input tax credit loss, following the GST exemption, as this cost was not passed on to distributors. |
Continued shift toward protection; traditional product trends diverge
The product-mix shift remained favorable for margins in 1QFY27, led primarily by strong protection growth, although trends within savings products were mixed across insurers. ULIP demand remained resilient for several players, despite capital market volatility, while participating, non-participating and annuity growth varied depending on product launches, pricing and the respective base.
4 | Traditional savings trends were mixed. Non-par savings grew strongly at HDFC Life and SBI Life, while Axis Max Life and Bajaj Life reported a decline due to a high base and product mix changes. Participating products grew strongly at Axis Max Life, ICICI Prudential Life, SBI Life and Bajaj Life, but declined at HDFC Life. Annuity growth remained healthy across several players, including Axis Max Life, HDFC Life, ICICI Prudential Life and ABSLI. |
4 | Retail protection remained the key growth driver. Retail protection APE grew 57% yoy at Axis Max Life, 43% at HDFC Life, 60% at ICICI Prudential Life and 19% at SBI Life, accompanied by healthy growth in individual sum assured. Protection growth also benefited from higher rider attachment across insurers, following the GST exemption. |
4 | Group protection trends improved, but remained uneven. ICICI Prudential Life and HDFC Life reported 38% and 14% yoy growth, respectively, supported by improving credit life and microfinance trends, while Axis Max Life’s group protection declined 4% yoy. SBI Life’s group protection APE increased more than fourfold. |
Distribution trends: Agency and partnerships gain traction; bancassurance weak for most
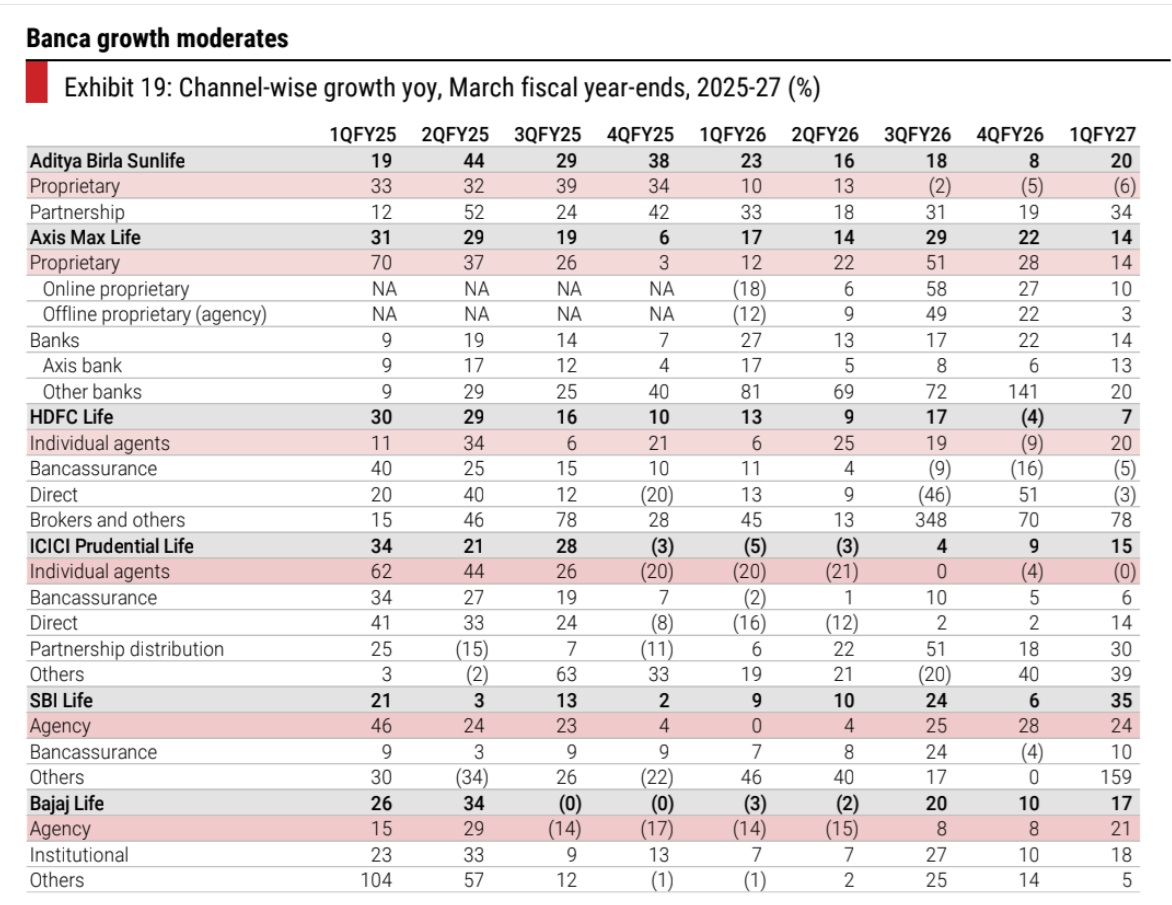
Distribution trends improved in 1QFY27, with agency and newer partnership channels emerging as key growth drivers, while bancassurance performance remained uneven across insurers. Overall, diversification into agency, proprietary and newer partnerships is supporting growth and reducing dependence on individual bank relationships, although bancassurance remains an important growth driver for most insurers.
4 | ABSLI’s partnership channels grew strongly by 34% yoy, offsetting a 6% decline in proprietary channels. |
4 | Axis Max Life reported balanced 14% growth across proprietary and banking channels, with Axis Bank and other banks growing 13% and 20% yoy, respectively; this is the only captive banca channel that fared well in 1Q. |
4 | Bajaj Life’s transformation strategy continued to gain traction, with agency and institutional channels growing 21% and 18% yoy, respectively. |
4 | HDFC Life’s agency and broker channels grew 20% and 78% yoy, respectively, partly offsetting a 5% decline in bancassurance due to subdued business at HDFC Bank; ex-HDFC Bank, other channels were up 17% yoy. |
4 | ICICI Prudential Life remained partnership-led, with partnership distribution growing 30% yoy, compared with 6% growth in bancassurance and broadly flat agency business. |
4 | SBI Life delivered 24% yoy agency growth and 10% growth in bancassurance, while other channels grew sharply, aided by the group term business. |
Persistency trends remained mixed
Persistency trends remained mixed in 1QFY27, with pressure in early cohorts for several insurers but improvement in longer-duration buckets. Axis Max Life’s 13th month persistency declined 300 bps yoy, partly due to a discontinued product variant, while its older cohorts improved. HDFC Life reported better 13th month and longer-duration persistency, while ICICI Prudential Life faced pressure in the early buckets. SBI Life improved across most cohorts, except the 61st month due to the maturing Covid-period cohort, which management expects to normalize by end-3QFY27. LIC reported weakness across most buckets. Overall, the trends indicate front-book volatility, partly offset by better persistency in older cohorts for several private insurers.
Cost ratios inched up
Cost ratios increased for most players in 1QFY27, partly reflecting the GST-related loss of input tax credit, the impact of the new labor code and continued investments in distribution. SBI Life and HDFC Life recorded the largest increases in the cost-to-APE ratios, while ICICI Prudential Life reported a meaningful improvement, supported by operating efficiencies. LIC’s cost ratio increased marginally, despite healthy premium growth. Overall, near-term cost ratios may remain elevated, although improving scale and expense rationalization should provide some offset through the year.
Operating RoEV of 14-19%
Private players will likely deliver 14-19% operating RoEV over FY2027-29E. We expect operating variance to be moderately positive over the medium term, driven largely by an improvement in persistency. The unwinding rate will largely be stable in the range of 8.0-8.9% for private players. APE growth will likely remain moderate at 14-20% over FY2027-29E.
Non‑life: Growth improved; claims trends mixed
The non-life industry’s premium growth improved to 12% yoy in 1QFY27, led by strong retail health and better motor growth, while commercial lines remained weak amid elevated competitive intensity. Standalone health insurers grew 32% yoy and industry retail health premiums increased 31%, continuing to benefit from stronger demand, following the GST exemption. Motor premium growth improved to 14% yoy, with private sector motor OD and TP premiums growing 18% and 16%, respectively, supported by better vehicle sales. In contrast, fire premiums declined sharply across several large insurers as companies remained selective on pricing. Claims ratios improved for Star Health and Niva Bupa, supported by past tariff increases, a higher share of new business and favorable business mix, while ICICI Lombard reported a sharp deterioration due to large commercial-line losses and the impact of the Supreme Court judgment on compensation for homemakers and unpaid domestic workers. Investment yields improved sequentially for most players, providing some support to earnings, although underwriting performance remained the key driver of divergence in profitability.
Bajaj General: Growth improves; underwriting remains weak
Bajaj General reported 10% GWP growth on an ex-crop basis. While the company went slow in fire, retail health was up 23% yoy and motor TP up 15% yoy; the company went slow in the OD business (up 6% yoy). Ex-crop, the claims ratio was down 140 bps yoy to 70%, while overall combined, it increased 110 bps to 104.7%. Unlike ICICI Lombard, the company has not made explicit provisions, following the recent Supreme Court judgment on the compensation of homemakers and believes that its current reserves are sufficient. Sharp rise in the combined ratio in 1QFY27. The combined ratio was up 110 bps yoy to 104.7% due to an interplay of (1) a sharp 320 bps rise in the claims ratio to 74.3% and (2) 210 bps yoy decline in the expense ratio to 30.4%. Lower contribution of commercial lines (lower claims ratio compared with other segments) and higher contribution of group health likely led to a sharp rise in the claims ratio during the quarter.
ICICI Lombard: Weak financials, despite improving motor and retail health growth
ICICI Lombard reported PAT of Rs4 bn, down 46% yoy and 52% below our estimate, weighed down by elevated claims and weaker investment income. The claims ratio increased 336 bps yoy and 558 bps qoq to 76.4%, reflecting two key one-offs—Rs0.63 bn of large fire losses and the impact of the recent Supreme Court judgment on compensation for homemakers and unpaid domestic workers, which increased the claims ratio by approximately 280 bps. Consequently, the combined ratio deteriorated to 107.2%, up 426 bps yoy and 598 bps qoq. Commercial line claims remained elevated, with the fire claims ratio rising 3,770 bps yoy to 118.3% and the engineering claims ratio increasing 1,920 bps to 86.6%. Investment yield declined 165 bps yoy to 7.5%, partly due to a Rs0.84 bn impairment on the equity portfolio, further weighing on earnings; unrealized gains moderated to Rs6.2 bn from Rs10 bn in 4QFY26 and Rs25.7 bn in 1QFY26. On the positive side, motor premium growth accelerated to 21% yoy from 16% in 4QFY26 and 3% in 3QFY26, reflecting improved OEM sales, while retail health growth remained strong at 65% yoy. However, fire premiums declined approximately 30% yoy as competitive intensity prompted the company to remain selective, constraining overall growth.
Star Health: Claims ratio improvement continues; strong new business growth
GWP growth (1/n-basis) was strong at 19% yoy in 1QFY27 versus 17% in FY2026. New business growth in retail health was strong at 37% yoy, driven by agency (26% new business growth), D2C (142% new business growth) and partnerships (33% new business growth). Multi-year policies contributed 40% of the new business in 1QFY27. Agency remains the key distribution channel for Star Health, contributing 85% of overall GWP and 73% of the retail new business in 1QFY27. Agency new business growth of 25% was driven by 7.7% growth in agency force and 19% rise in agent productivity to Rs0.15 mn premium per agent. The combined ratio was down 156 bps yoy to 97.1%, driven by a sharp decline in the claims ratio (down 100 bps yoy) to 67.5%. The acquisition ratio was largely stable qoq at 23.4% (23.4% in 4QFY26 and 23.5% in 1QFY26).
Niva Bupa: Strong retail growth accompanied by sharp claims improvement
GWP growth was strong at 23% yoy in 1QFY27 on an n-basis (up 27% yoy in FY2026). On a 1/n-basis, GWP growth was higher at 32% due to the benefit of premiums being deferred in previous periods. Retail GWP growth was higher at 36% yoy (47% on 1/n-basis) while group premiums were down 5% yoy. New business growth in retail health was also elevated at 41% yoy. Niva Bupa reported a 380 bps yoy and a 279 bps qoq decline in the claims ratio to 63%. The retail claims ratio was down 90 bps yoy to 67.5%, driven by a higher share of new business. The group claims ratio was down to 48.4% from 63.2% in 1QFY26 due to a lower share of employee-employer business. While bancassurance and broker grew at 26-32% yoy, agency GWP was up 44% yoy in 1QFY27.
