Major net inflows seen in Arbitrage & Broad Based Equityfunds: MO AMC study


FinTech BizNews Service
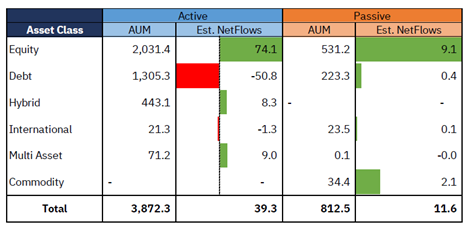
Mumbai, Nov 7, 2023: A study ‘Where the money flows’ by Motilal Oswal Asset Management Company (MOAMC) reveals Active Equity funds leading the way with net inflows of about Rs.74K Cr in July – September quarter, followed by Rs.9K Cr in Passive Equity funds. The study shows Arbitrage funds gaining popularity presumably as investors turned to Arbitrage funds as a more tax-efficient substitute to Liquid funds. At >80% of market share, Arbitrage & Broad Based categories took away the lion’s share of net inflows into Equity funds during July – September quarter.
The study aims to provide insights into investor preferences within the Mutual Fund industry with a detailed analysis of estimated net flows various categories of mutual fund schemes. It reveals a total net inflow of Rs.51K Cr in mutual funds (across all categories/asset classes) in the last quarter, of which ~Rs.39K Cr was in Active funds and ~Rs.12K Cr in Passive funds. 29 new schemes were launched during this period, collecting ~16k Cr in AUM. The data in the study reveals that Broad-based funds have seen the highest net inflows at ~Rs.42k Cr, while ELSS and Focused funds registered combined net outflows of ~Rs.2k Cr. Looking at the big picture, just 3 AMCs took away almost half of the quarterly net inflows, while 1 AMC accounted for 2/3rd of the quarterly net outflows.
Pratik Oswal, Head of Passive Funds, Motilal Oswal Asset Management Company Ltd said, “Currently, there is no comparable data of net flows available to make objective and easy comparison between Active and Passive funds across different categories. Our aim with this report is to present a snapshot of the changing dynamics and emerging trends within the Mutual Funds industry in the past quarter. We believe this will be very helpful for investors as well as investment advisors to make informed decisions.”
Mahavir Kaswa, Head of Research (Passive Funds), Motilal Oswal Asset Management Company Ltd said, “We have developed our own proprietary 5-level classification model for mutual fund schemes, based on aspects like style of investing, asset class, category within asset class, sub-type within each category, and route/format of investing. This helps us to analyse the entire industry with a high level of granular detail and draw meaningful insights into where investor’s money is actually flowing.”
MF Industry has grown >5X in the last 10 years, with AUM growing from Rs.8.3 Lakh Cr in December ’13 to Rs.46.4 Lakh in September ’23. During the same period, Passive AUM market share has grown to over 17% from meagre market share of less than 1.5% in 2015 Equity takes away the majority of the share at 54%, while Debt market share is at 32%, Hybrid is at 9%, and the remaining is in Multi-Asset, International, Commodity, and Solution Oriented funds.
Synopsis of ‘Where the money flows’ by MOAMC:
Equity funds take a front seat
The mutual fund industry has recorded net inflows of approximately Rs.51k Cr in Q2-FY24. Active Equity funds led the way with net inflows of about Rs.74K Cr, followed by Rs.9K Cr in Passive Equity.
On the Passive side, Equity claimed the lion's share with around 78% of net inflows, while commodities held an 18% share.
Active Debt funds experienced net outflows of ~Rs.51K Cr.
Within Equity, investors flock to Broad Based & Arbitrage funds
The study reveals that at >80% of market share, Arbitrage & Broad Based funds took away the lions share of net inflows in Q2FY24.
The Broad Based category in both Active & Passive Equities attracted significant net inflows, of which EPFO accounted for most of the flows in Passive. Among Active Equity funds, the Focused and ELSS categories experienced the highest net outflows, totalling around ~2k Cr. While, in Passive equities, thematic funds accounted for the entire net outflows of ~1.9k Cr
Impressive returns in the Active Small Cap segment catch the eye of investors
According to the findings of the study, Investors continued to bet on Active Small Cap funds highlighting high investor risk appetite taking away ~1/3rd of the ~33k Cr net inflows.
The study reveals that Active Multi Cap funds picked up steam with two NFOs garnering ~2k Cr out of the ~8k Cr net inflows in Q2FY24. Investors flocked to Passive Large Cap funds with the category receiving ~90% of all net inflows while Active Large Caps experienced outflows.
Other Passive categories like Mid & Small caps also received high net inflows considering relatively small AUM.
In the last 5 years, Passive funds have received increasing share of net flows
On a cumulative basis, Equities have received 6.8 Lakh Cr in Estimated Net Flows since December 2018. The split of these flows between Active & Passive equity funds is roughly 2:1.
The steep rise in flows to passive funds can be largely attributed to investments by EPFO in the past 5 years. Even if we exclude EPFO flows, Passive equities have received ~78k Cr in flows.
Within Debt, the Constant Maturity funds remains out of focus in both Active & Passive
Debt Funds faced substantial net outflows in the past quarter with Constant Maturity funds accounting for over 99% of the ~50k Cr net outflows. This was followed by Banking & PSU and Target Maturity categories. Floating Rate and Gilt funds were the only categories to receive net inflows.
Interestingly, while Active Constant Maturity saw net outflows, Passive Constant Maturity funds attracted net inflows.
Liquid & Money Market funds drive net outflows
Liquid & Overnight funds accounted for more than 90% of net outflows from Constant Maturity category, followed by Ultra Short & Short Duration funds. Most of these net outflows came during August and September.
Generally, investors use Debt funds with maturity up to 1 year to park excess cash in the short term, leading to high volatility in inward & outward flows. Low Duration & Money Market funds on the other hand, saw net inflows of ~11k Crs in aggregate.
Investors flock to Multi Asset Funds
Multi Asset funds led the hybrid category with some large NFOs, securing half of the net inflows, followed by Balanced Advantage funds (BAF) and Equity Savings funds, which claimed over 40% of the share. After 3 consecutive quarters of net outflows, Equity Savings funds saw a reversal of flows this financial year, likely driven by investors transitioning to tax-efficient equity schemes with relatively lower volatility. Balanced Advantage funds also saw a shift from four consecutive quarters of net outflows to net inflows.
Investor Shift: Amidst heavy net outflows in Hybrid funds, Balanced Advantage Funds are a knight in shining armor
On a cumulative basis, Hybrid funds have received net outflows of ~26k Cr since December 2018. Balanced Advantage and Equity Savings funds led the way, with the Hybrid category attracting net inflows across all sub-categories. The Hybrid category saw relief with the introduction of Balanced Advantage funds (BAF), allowing fund managers flexibility in asset allocation and driving consistent cash flows due to aggressive promotion by several AMCs.
International Funds see outflows in Q2FY24
In July – September quarter, outflows from the International funds category occurred across various styles and categories, primarily attributed to the Mutual Funds industry breaching its outward remittance limit set by the RBI, volatility in international markets and recent performance of Indian market. Along with this, the recent changes in taxation for International Funds has also dampened investor sentiment.
(Disclaimer: The information contained herein is for general purposes only and not a complete disclosure of every material fact. The information/data/charts herein alone is not sufficient and should not be used for development or implementation of any investment strategy. All opinions, figures, estimates and data are as on date. The content does not warrant the completeness or accuracy of the information and disclaims all liabilities, losses and damages arising out of the use of this information. The statements contained herein may include statements of future expectations and other forward-looking statements that are based on our current views and assumptions and involve known and unknown risks and uncertainties that could cause actual results, performance or events to differ materially from those expressed or implied in such statements. Readers shall be fully responsible/liable for any decision taken on the basis of this article.)