Depositors Rush to Lock Capital in Longer TDs
Currency With Public Up 13.6% Y/Y @ Rs42101.70 Bn
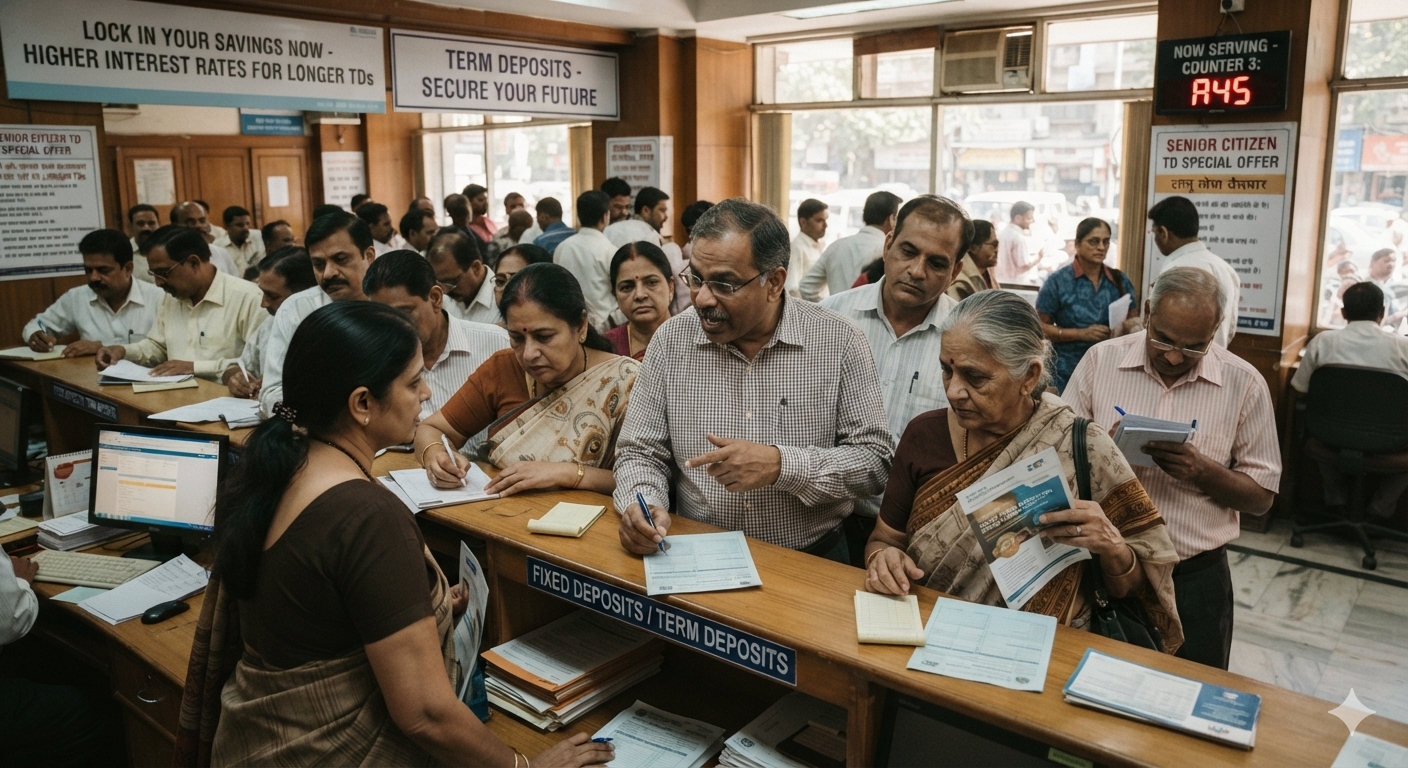 The image generated using AI
FinTech BizNews Service
Mumbai, 02 October, 2026: Reserve Bank of India today released Bulletin Weekly Statistical Supplement – Extract.
Here is an analysis:
Reserve Bank of India: Liabilities and Assets Analysis
State government loans and advances from the RBI dropped sharply by Rs10,836 crore over the week ending September 25, 2026.
Loans and Advances: State Governments
- Current Balance (Sep 25, 2026): Rs8,590 crore
- Previous Week (Sep 18, 2026): Rs19,427 crore
- Previous Year (Sep 26, 2025): Rs32,622 crore
- Weekly Variation: Decrease of Rs10,836 crore
- Yearly Variation: Decrease of Rs24,031 crore [1]
💡 Key Takeaways
- Subdued Sub-national Borrowing: States reduced reliance on RBI short-term liquidity (Ways and Means Advances / Overdrafts).
- Fiscal Position: Indicates improved cash flows or alternative market borrowing for state governments.
- Central Government: Remains at zero, showing no recent short-term overdraft utilization with the central bank.
- Foreign Exchange Reserves Analysis
- India's total foreign exchange reserves stood at Rs7,164,287 crore (equivalent to $747,557 million) as of September 25, 2026, marking a weekly contraction of Rs178,698 crore ($18,343 million).
- Breakdown of Reserve Components (As of Sept 25, 2026)
- 💵 Total Reserves
- Amount: Rs7,164,287 Cr / $747,557 Mn
- Weekly change: -Rs178,698 Cr / -$18,343 Mn
- Trend: Sharp weekly pullback following prior accumulation phases.
- 🌐 Foreign Currency Assets (FCA)
- Amount: Rs5,897,822 Cr / $615,411 Mn
- Weekly change: -Rs151,661 Cr / -$15,570 Mn
- Driver: Primary contributor to the headline drop via revaluation or central bank intervention.
- 🥇 Gold Reserves
- Amount: Rs1,041,743 Cr / $108,701 Mn
- Weekly change: -Rs25,264 Cr / -$2,591 Mn
- Driver: Reflects global bullion price fluctuations or periodic adjustments.
- Special Drawing Rights (SDRs)
- Amount: Rs178,656 Cr / $18,642 Mn
- Weekly change: -Rs1,001 Cr / -$97 Mn
- Trend: Marginal downward adjustment
- 🏦 IMF Reserve Position
- Amount: Rs46,066 Cr / $4,804 Mn
- Weekly change: -Rs772 Cr / -$86 Mn
- Trend: Stable with negligible variaation
- Key Observations & Macro Context
- Intervention Dynamics: The sizeable drop in Foreign Currency Assets indicates active dollar sales or valuation impacts from major currency movements against the US dollar.
- Liquidity Confluence: Concurrently, RBI’s liquidity operations show persistent net absorption across the corresponding statement period, illustrating a synchronized management of domestic liquidity and external buffers.
Scheduled Commercial Banks (SCBs) – Business in India, extracted from the latest Reserve Bank of India (RBI) Weekly Statistical Supplement (WSS) as of September 15, 2026, provides critical insights into the structural trends of credit expansion, systemic liquidity, and depositor behavior.
As per the revised reporting framework mandated under the Banking Laws (Amendment) Act, 2025 (which altered the definition of a fortnight from alternate Fridays to the 15th and last calendar day of a month), the banking sector displays a divergent short-term and long-term momentum.
📊 Structural Overview: Deposits vs. Credit (As of Sept 15, 2026)
While short-term contractionary fluctuations were visible over the reported fortnight, the long-term, year-on-year trajectory reveals an aggressive pace of expansion across both lending activities and deposit accumulation.
As of September 15, 2026, Aggregate Deposits stood at Rs27,623,066 crore (showing a fortnightly dip of -Rs248,508 crore but a robust YoY growth of +17.3% to +4,076,615 crore), while Bank Credit reached Rs22,329,258 crore (contracting by -Rs57,894 crore over the fortnight yet expanding by +18.1% or +3,426,398 crore YoY). Detailed breakdown values for demand and time deposits, as well as food and non-food credit, are available in the referenced statistical supplement.
🔍 Key Analytical Insights
Credit-to-Deposit (C-D) Ratio & Growth Convergence
- YoY Outperformance: Bank credit expanded by 18.1% YoY, outpacing deposit growth at 17.3% YoY. This dynamic continues to exert structural upward pressure on the Credit-to-Deposit ratio, indicating tight structural credit supply relative to base funding.
- Fortnightly Correction: The reported fortnight saw both credit and deposits contract, aligning with standard corporate tax outflow cycles and government revenue mop-ups typical of mid-September.
Sectoral Allocation Dynamics (The Non-Food Engine)
- Economic Underpinning: Credit expansion is almost entirely driven by the Non-food Credit segment (accounting for over 99.5% of total bank credit). Secondary data releases from the RBI indicate this engine is heavily backed by a 24.3% YoY surge in services sector financing and robust mid-to-large industrial credit deployment.
- Core Stabilisation: Food credit variations remain marginal over the fortnight and restricted to public procurement actions.
Depositor Shift: Time Deposits Reign Supreme
- Yield-Seeking Behaviour
- In the ongoing financial year (2026-27), Time (Term) Deposits registered strong accumulation, whereas Demand Deposits contracted.
- The Takeaway: Depositors are aggressively locking capital into longer-duration term deposits to exploit attractive interest rates. This transition reduces the pool of low-cost current and savings accounts (CASA), creating higher blended funding costs for scheduled banks
Credit Trends with RBI Liquidity Operations (LAF)
Liquidity Operations Overview (Sep 21–27, 2026)
- Net Stance: Persistent net liquidity absorption across all days, peaking at Rs311,826 crore on Sept 25. [1, 2]
- Standing Deposit Facility (SDF): Actively utilized by banks to park excess funds, ranging from a high of Rs221,744 crore (Sept 25) to a low of Rs147,625 crore (Sept 23). [1]
- Variable Rate Reverse Repo (VRRR): Used moderately mid-week (e.g., Rs101,399 crore on Sept 24), but dropped to zero over the weekend.
- Repo / MSF: Standard Repo remained untouched; Marginal Standing Facility (MSF) usage stayed minimal (under Rs10,300 crore), indicating comfortable systemic cash conditions. [1]
💡 Key Takeaways
- Surplus Liquidity: The banking system continues to run on a significant structural surplus, prompting the RBI to absorb funds primarily via the SDF rather than traditional Repo injections.
- Monetary Transmission: High SDF absorption reflects strong baseline liquidity, keeping short-term money market rates anchored close to the SDF rate.
When evaluating aggregate societal welfare, a balance between productive credit availability and monetary stability is essential. Unchecked credit growth risks destabilising inflation, while excessive liquidity absorption depresses employment and enterprise. The data from the Reserve Bank of India WSS Releases illustrates this calibrated balance:
+-----------------------------------------------------------------------------------+
| THE SYSTEMIC LIQUIDITY CYCLE |
| |
| SCB Balance Sheet (Table 4) RBI Market Operations (Table 8) |
| --------------------------- ------------------------------- |
| Bank Credit YoY: +18.1% Daily Standing Deposit Facility (SDF) |
| Aggregate Deposits YoY: +17.3% ======> Absorption: Rs1.5 - Rs2.6 Lakh Cr |
| C-D Ratio: Structural Pressure Variable Rate Reverse Repos (VRRR) |
| Net Absorptions: -Rs2.5 to -Rs4.0 Lakh Cr |
| |
| Outcome: Prevents unchecked monetary dilution while keeping productive capital |
| flowing to service and industrial sectors. |
+-----------------------------------------------------------------------------------+
Systematic Absorption to Anchor Price Stability
- Durable Surplus Absorbed: Despite credit expanding by +18.1% YoY, scheduled commercial banks consistently parked large liquidity surpluses back with the central bank via the Standing Deposit Facility (SDF)—often between Rs1,50,000 crore and Rs2,60,000 crore daily—and periodic Variable Rate Reverse Repo (VRRR) auctions.
- Minimising Inflationary Harm: Absorbing surplus bank reserves prevents idle bank capital from stoking short-term speculative asset bubbles. This preserves the purchasing power of lower- and middle-income households while enabling banks to earn risk-free returns under the SDF corridor.
Preserving Orderly Financial Intermediation
- Buffer Against Strain: With credit growth (+18.1% YoY) outpacing deposit growth (+17.3% YoY), bank balance sheets would experience systemic vulnerability if liquidity tightened abruptly. [1]
- Calibrated Accommodation: The operational Cash Reserve Ratio (CRR) of 3.00% maintains liquid reserves within the banking system, ensuring productive infrastructure and service sectors receive necessary capital without causing abrupt interbank friction or spikes in the call money market.
Deep Dive: Broad Money Supply (M₃) and Collective Wealth
Money Stock Analysis
The components of money stock demonstrate how public saving behaviour and bank credit creation affect the real economy. As of late September 2026, Broad Money (M₃) reached Rs33,067,446 crore, growing at 16.6% YoY.
Money Stock Decomposition (Late September 2026)
M₃ Component | Outstanding (Rs Crore) | YoY Absolute Variation (Rs Crore) | YoY Growth (%) | Systemic Implications |
Currency with the Public | Rs4,210,170 | +Rs5,03,482 | +13.6% | Sustained transactional reliance in informal & rural supply chains. |
Demand Deposits | Rs3,491,475 | +Rs4,86,634 | +16.2% | Operational liquidity for corporate trade and working capital. |
Time Deposits with Banks | Rs25,320,000+ | +Rs36,00,000+ | +17.0%+ | Dominant driver; household capital secured into fixed-income yields. |
Total Broad Money (M₃) | Rs33,067,446 | +Rs47,17,225 | +16.6% | Broad monetary expansion aligned with nominal GDP growth. |
Broad money (M₃) stands at Rs33,067,446 crore as of September 15, 2026, reflecting a financial year growth of 3.9%.
💡 Components of Money Stock (M₃)
- 💵 Currency with Public: Rs4,210,170 crore (up 2.1% this financial year).
- 🏦 Demand Deposits: Rs3,491,475 crore (grew 5.8% over the financial year).
- ⏳ Time Deposits: Rs25,242,433 crore (steady expansion of 4.0% in 2026-27).
- 🏛 Other Deposits with RBI: Rs123,368 crore (up 2.8% in the financial year).
🔎 Sources of Money Stock
- 📈 Net Bank Credit to Government: Rs9,551,257 crore, declining marginally by 0.2% over the fortnight.
- 📈 Bank Credit to Commercial Sector: Rs23,247,931 crore, expanding 3.4% so far this financial year.
- 🌐 Net Foreign Exchange Assets: Driven largely by robust banking sector foreign assets reflecting external sector inflows.
