Understanding New Age of Reciprocal Tariffs; From America FIRST / MAGA (Make America Great Again) to MAA / (Make America Alone)
Dr. Soumya Kanti Ghosh,
Group Chief Economic Adviser
State Bank of India
Mumbai, April 4, 2025:
Equity markets sink.....
❑ Equity markets across the world slumped, after US President Donald Trump’s sweeping trade tariffs stoked fears of
an all-out trade war and fears of a global economic recession
❑ A day after showing remarkable resilience amid a sharp global sell-off, the Indian stock market witnessed deep
losses. Benchmark indices, the Sensex crashed over 800 points, while the Nifty 50 dropped 292 points, dragged
down by weak global cues
Dollar sinks against other Currencies
❑ US tariff announcements sent the value of US dollar plunging, indicating that investors are worried about a recession in US. Additionally, tariff is
supposed to reduce demand for imports, which means there is less need for businesses to exchange dollars for other currencies to buy foreign
goods
❑ USD index has declined significantly to 102, down by 1.7% on 03 April and 3.7% in the last 1-month, from 105.7 on 04 March 2025 (a lower
number means a weaker dollar)
❑ Rupee has appreciated in the last 2-days, while China’s Yuan is depreciating against dollar. This opens up the possibilities of large scale
dumping into India......
US Reciprocal Tariff
❑ United States President rolled out sweeping
reciprocal tariffs against countries that have high
tariffs on US exports and also announced a
baseline 10% tax on all imports
❑ Asia and Europe have been hit the hardest.
While China faces a 34% rate, European Union
is going to have a 20% levy while Vietnam is
seeing a 46% tariff
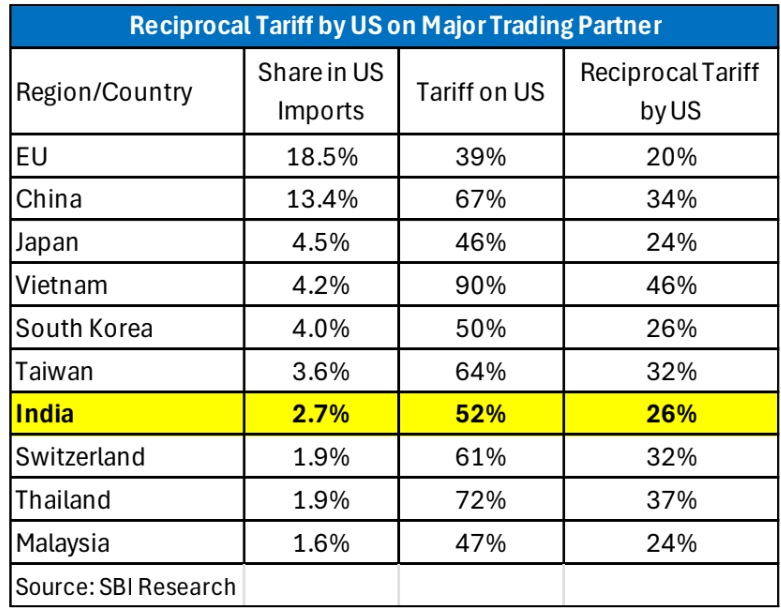
❑ India face the reciprocal tariff of 26% (universal
10% tariffs on all imports into the US will take
effect from April 5, with the remaining 16%
applied from April 9)
Impact on Global Economy
❑ The reciprocal tariff by US may be the biggest change in last 100 years, beyond those seen during the high
protectionism of the 1930s
❑ This may affect the Asian nations the most and thousands of company’s business models may be affected.
However, this will mop-up the revenue of the US and expected for a tax cut, which will adjust the US
consumer's budget
❑ World export volume may decline from 2.9% in 2024 to 1.3% in 2025-2026, mainly due to weaker demand
in US and uncertainty affecting global investment and confidence
❑ The broad-based nature of the tariffs and potential retaliation by other countries is likely to have a negative
impact on global growth
❑ India’s exports to the US is only 4% of GDP so direct impact is limited. Impact will be more from overall
global growth slowdown and heightened global financial volatility
Impact on US Economy
❑ The US reciprocal tariff not only negatively impact major trading economies but has negative impact on US
economy also
❑ One model constructed by the Federal Reserve Bank of Boston suggests that in an extreme scenario (assumes
60% tariff rates on Chinese imports and 10% tariff rates on imports from all other countries), heightened taxes
on US imports could result in a 1.4 percentage point to 2.2 percentage point increase to core inflation
❑ Price increases could come across many categories, including new housing and automobiles, alongside
consumer services such as nursing, public transportation and finance
❑ Research indicate that regarding the impact on US economy, the tariffs decrease US GDP by $438.4 billion
(1.45%). Divided among the nation’s 126 million households, GDP per household decreases by $3,487 per year
❑ IMF earlier estimate that a universal 10% rise in US tariffs, accompanied by retaliation from the euro area and
China, could reduce US GDP by 1% and global GDP by roughly 0.5% through 2026. Roughly half of the GDP
decline from higher tariffs is attributed to a negative sentiment shock related to rising trade policy uncertainty
Trade Wars are not easy to Win
❑ The general perception of economists on trade wars is that they are not easy to win, even for large countries such as the United States (Berthou et al. 2018). Unilateral protectionist measures are often subject to retaliation by trade partners
❑ Output Impact: General equilibrium quantitative trade models can be used to simulate the long-term effects of trade wars. The results obtained from these models have been summarised by Paul Krugman: a generalised tariff increase of between 30 and 60 percentage points (pp) would lead to a global real GDP loss of 2% to 3% over the long term. Similar figures are provided in a recent note published by the French Council of Economic Analysis, which states that a 60 pp increase in import tariffs would result in a 3% to 4% decline in real GDP in large economies in the long run
❑ Tariff Pass-Through: Dealing with endogeneity of tariffs is a concern in analyses of the effects of trade policy (Goldberg and Pavcnik, 2016). In the case of the trade war, conditional on the fixed effects that enter in the controls, the tariff changes were uncorrelated with previous price and import trends across products
❑ Price Impact: The most direct way to assess consumer effects through higher prices is by looking at consumer prices. Cavallo et al. (2021) suggest that complete pass-through to retail prices may not hold broadly. They use online prices from two large US retailers and are able to identify goods that are subject to the tariffs. In contrast to the complete pass-through at the port, they find that final consumer prices are barely affected. So, for retail goods such as a household goods and electronics, the cost of the tariffs is on the retailers, not final consumers
❑ Exchange-rate pass-through: From the perspective of an exporter to the US, a depreciation of the exporter’s currency is a positive demand shifter as much as a tariff reduction. Hence, appreciations of the exporter’s currency and import tariffs should have similar effects on prices. The typical finding has been incomplete exchange-rate pass-through: a depreciation of the exporter’s currency typically increases the foreign-currency prices faced by the importer
India-US: Current Trade Dynamics
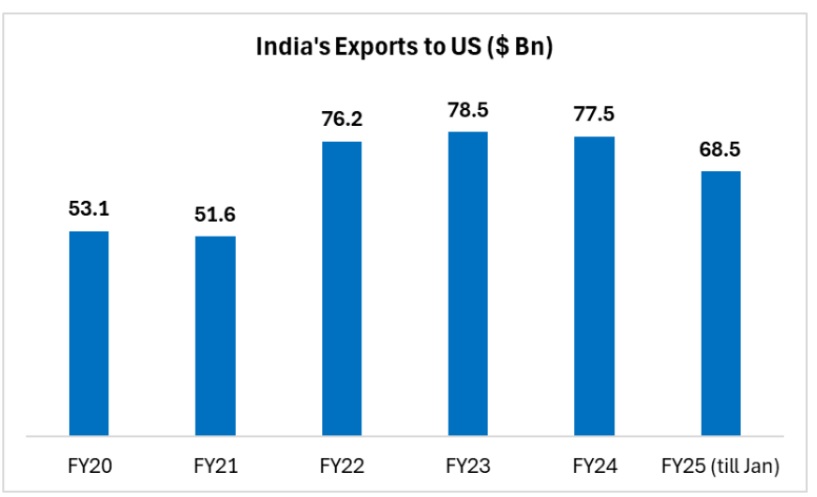
❑ India’s exports to US are on declining trend since FY23 with the share in total exports around 17-18%
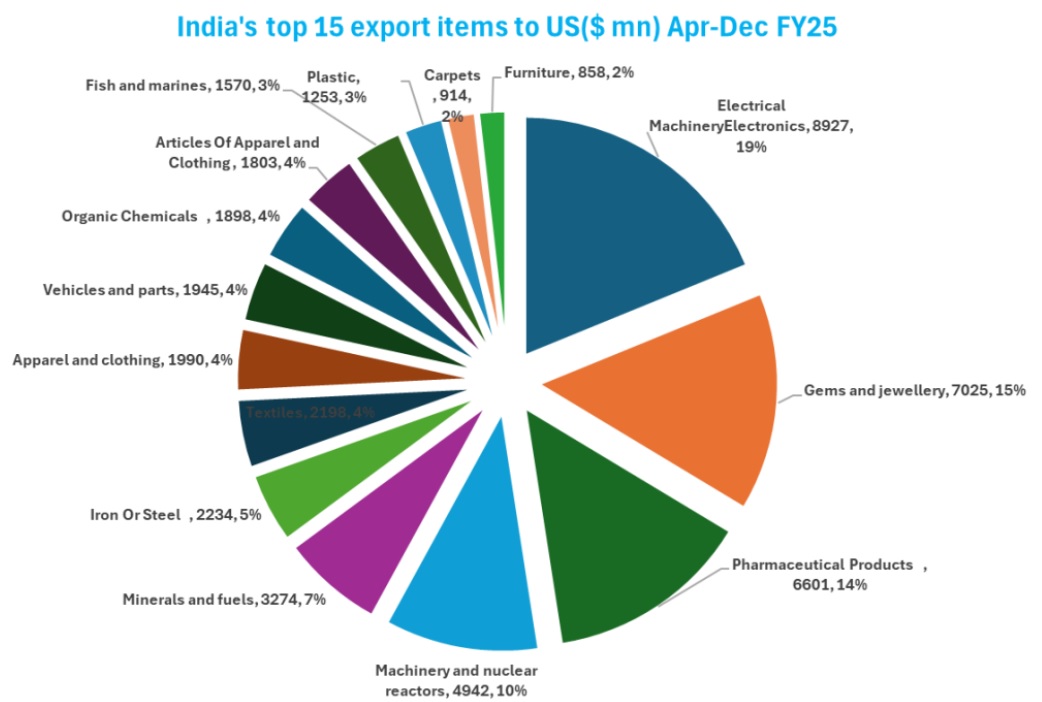
❑ Top 15 items exported to US accounted for 63% of total exports
Sectors to be Impacted due to Tariff.. Textiles, Engineering and Gems and Jewellery
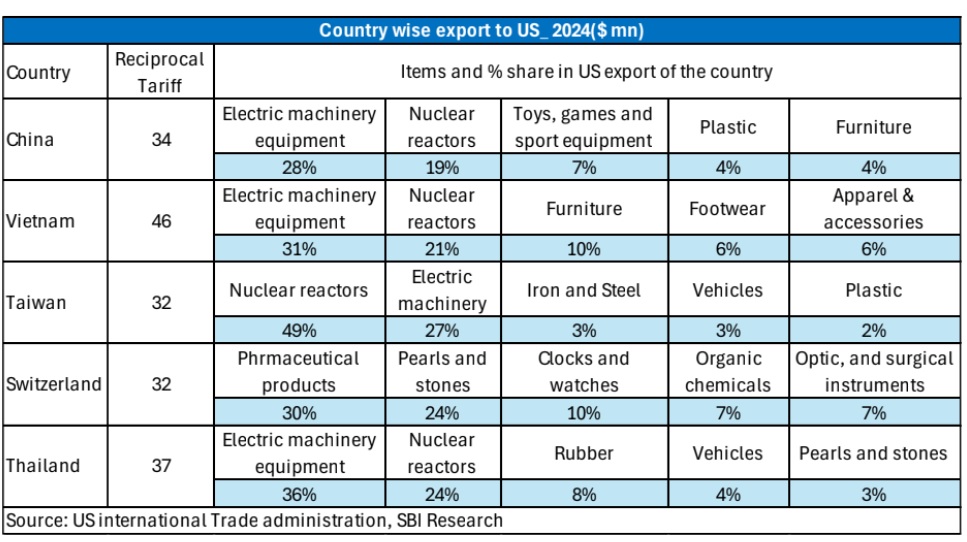
Tariff levied on India is lowest among its Asian peers, as 34% on China, 36% on Thailand, 32% on Indonesia, 46% on Vietnam.
We expect India will have competitive advantage and export-oriented impact on sectors explained below:
❑ Textiles: The higher tariff on textile export-oriented countries like Bangladesh, China, Vietnam etc, may lead to lower demand
due to inflationary pressures. However, in long term India stands to benefit as it endeavors to corner a larger share of the
market.. India’s export to US on textile products is around $7 billion during Apr-Dec, FY25. So, we expect, this sector may be
impacted negatively in short run but may have positive impact in long-run
❑ Engineering Goods: This sector may be severely impacted due to disruption in supply chain and cutting export revenues
❑ Electronics: China has tariff of 54% to 79%, so, India has a better position than the key electronics export countries. India
exports electronics to US around $9 billion during Apr-Dec, FY25, which hold highest share of 15% to total exports
❑ Gems & Jewellery: Gems and jewellery sector will be the most affected as import tariffs may be up to 20% from the current
0% on loose diamonds and 5.5-7% on gold jewellery. US accounts for nearly $10 billion or 30.4% of India's annual gems and
jewellery exports of $32 billion
❑ Agricultural Products: India’s agricultural exports to the US are expected to remain stable or even grow, as competing
nations face steeper duties. India’s seafoods exports to US stands at $ 1.5 billion during Apr-Dec, FY25, which is 3% share of
total exports to US. We expect, India’s relative tariff advantage will help Indi’s seafood exporters, as consumption will not
decline instantly
Impact on Growth and Exports Scenario 1
Tariff shocks transmitting to GDP and Exports...
❑ Objective: To evaluate the impact of 26% reciprocal tariffs imposed by USA on India’s exports and GDP.
Given the interdependencies between trade policies and macroeconomic indicators, we tried to uncover the
extent to which tariff induced shocks propagate through the economy
❑ Methodology: We employ a Structural Vector Autoregressive model which allows us to analyze the impact of
tariff shocks to model the relationship between Tariffs and exports and GDP
❑ Model: A SVAR model is given by
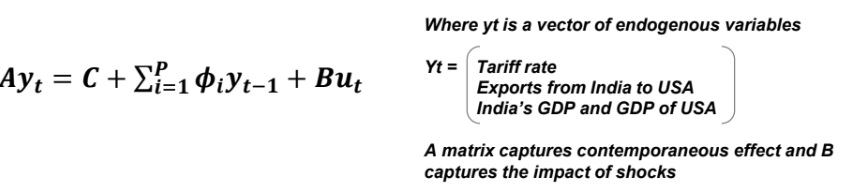
❑ The significant results of shock matrix reflecting that tariff induced disturbances propagate to GDP and
Exports
Tariff shocks transmitting to GDP and Exports...
❑ Furthermore, Impulse Response Functions are used to model the dynamic changes in GDP and exports due to shocks in
tariff rates. The IRF indicates that a rise in tariff has negative impact on both exports and GDP till T4. After 5 years, the
shocks dissipates indicating a disruptive perturbation to GDP and exports
❑ The estimated coefficients indicate that a rise in tariff rates to 26% could potentially lead to a decline in exports by $10 bn.
And a contraction in GDP by at least $7.8 bn in the immediate year (cumulatively 50bps) underscoring the significant
macroeconomic repercussions of trade protectionism
❑ Thus, while the initial impact is huge, overtime adaptive recalibrations ensures that extent of decline fades
Impact on Growth and Exports Scenario
The proposed tariff will impact annual GVA growth by 35-40 bps in FY26 in the worst case
with full pass through... The loss could be much lower if the pass through is limited to usual elasticity coefficient
Impact on Domestic Inflation
Cheap imports may lead to low inflation
❑ US has imposed reciprocal tariff to many economies that is more than India’s
❑ This will increase the fear of dumping into India by these countries resulting in lower inflation
The negative value-add shock to create mild reduction in domestic prices
How J will turn L
Tariffs could contradict conventional J-Curve Hypothesis...
Context
❑ J-Curve Hypothesis – describes how with after a currency depreciation, a country's trade balance initially worsens before
improving.
❑ In the short run, import costs rise while export volumes remain unchanged due to existing contracts, habits or slow foreign
demand adjustment. As time passes, imports decline as domestic consumers shift to local goods, and exports become more
competitive, boosting foreign demand.
❑ This delayed response creates a J-shaped trade balance trajectory. The effect depends on import and export price
elasticities—if demand is highly responsive to price changes, the trade balance recovers faster, making exchange rate policy
crucial for trade stability
The Problem
❑ We believe large-scale US Tariffs will create a hostile global environment blocking the expected J-Curve recovery for India,
even if the Rupee weakens
❑ This could be due to...
• Weak Global Demand (tariffs and uncertainty slow down the world economy; indicating less demand for Indian exports too, regardless of
price)
• Retaliation (other countries might impose their own tariffs, blocking Indian goods from key markets)
• Supply Chain Chaos (tariffs disrupt global supply chains, Indian exporters might face higher costs for imported parts, making them less
competitive)
Tariffs could contradict conventional J-Curve Hypothesis...
Empirical Substantiation
We tried to visually compare the path of India's trade balance following significant INR depreciation episodes during periods of
high vs. low US trade policy uncertainty (TPU – Index by Baker, Bloom, Davis)
❑ Distinct periods of significant INR depreciation were chosen for study – one at high TPU period (Jun’18 – Jun’19, Trump’s first
phase), and other at low TPU period (Nov’13 – Nov’14)
❑ Plotting the indexed trade balance - reveals that indexed trade balance path tends to stay lower for longer in case of high
trade policy uncertainty, while trade balance heals relatively quickly in environments with lower TPU
Tariffs could contradict conventional J-Curve Hypothesis...
Likely Impact
❑ Potential impact of heavy tariffs would be – No Sharp ‘J’ Curve.... the initial dip (worsening of trade balance) still happens, but
the vital volume effect (more exports, fewer imports) is choked off, meaning the trade balance could stay low for much longer
than usual. The eventual improvement might be much weaker, perhaps never reaching the pre-depreciation level
❑ Widespread tariffs create a hostile environment for the trade volume adjustments needed for the J-curve's recovery phase.
They introduce frictions, reduce overall demand, and increase uncertainty, all of which can significantly delay, weaken, or
even negate the expected improvement in the trade balance following a currency depreciation. Thus, the resulting path could
very well resemble a protracted "U" shape or even an "L" shape, representing a stark distortion of the classic J. We propose
this as a strong argument that the simple J-curve model may not apply straightforwardly during intense trade conflicts
Policy Implication
❑ In a new world with significant tariffs and trade uncertainty, relying on a weak rupee to automatically fix the trade
balance (the J-Curve) is risky, as the usual J-curve recovery is likely to be hindered
❑ Focusing on export diversifying while simultaneously building domestic demand resilience becomes paramount to cushion
the economy from prolonged external trade weakness and uncertainty
What India Should do?
❑ US tariff imposed on India is 26%, which is higher than tariffs imposed by India of 15% on US. Now India should focus
on the potential negotiations with US. The India-US ongoing trade deal will resolve this issue, as India is open to
cutting tariffs substantially for over $23 billion worth of U.S. goods being sold to India
❑ Higher reciprocal tariffs in China, Vietnam, Bangladesh, and Indonesia may give India a competitive edge. Indian
exporters are expected to take out potential gains compared to the Asian peers and anticipated supply chain shifts are
expected to open new export opportunities
❑ To fully leverage this potential, the Indian government should expand existing Production Linked Incentive (PLI)
schemes in these sectors to cover a wider range of products and extend their duration by 3 years, thereby bolstering
domestic industries’ investment and global competitiveness
❑ With Trump charging a higher tariff on China, sectors where India can gain market share in shipments to U.S. include
textiles, apparel and footwear. Also, India sees an opportunity in raising exports of iron and steel products too, where it
has manufacturing competence
❑ Plans to negotiate the first tranche of a mutually beneficial, multi-sector Bilateral Trade Agreement (BTA) by
fall of 2025 to find & fix new, fair-trade terms to cater to ambitious aspirations, aligned with objectives of the
COMPACT.... Both nations to take an integrated approach to strengthen and deepen bilateral trade across the
goods and services sector, working towards increasing market access, reducing tariff and non-tariff barriers,
and deepening supply chain integration.