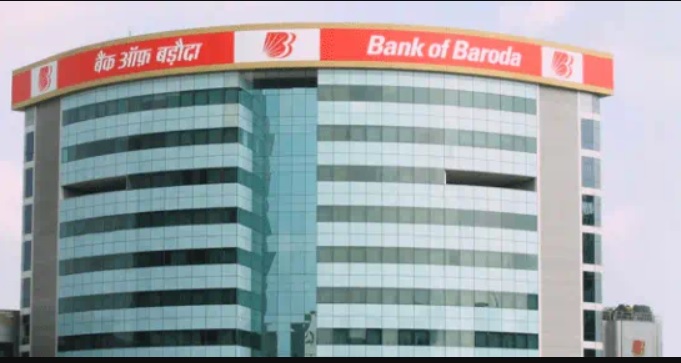
BoB’s Highest-Ever Qtrly Net Profit of Rs65 Bn
Gross NPA improved to 1.78% from 2.16% a year ago, while Net NPA stood at 0.37%
FinTech BizNews Service
Mumbai, 31 October, 2026:Bank of Baroda announced financial results on Friday for the quarter and half year ended 30th September 2026.
Bank of Baroda reported its highest-ever quarterly net profit of Rs6,532 crore, registering a growth of 35.8% year-on-year (YoY) in Q2FY27.
Highlights
- Bank delivers highest ever quarterly Net Profit of INR 6,532 crore (+35.8% YoY). Net Profit for H1FY27 stands at INR 7,810 crore.
- Net Interest Income (NII) for the quarter expanded by 9.0% on a YoY basis and stands at INR 13,026 crore. NII stands at INR 25,551 crore for H1FY27 (+9.2% YoY).
- Non-Interest Income stands for the quarter at INR 6,881 crore (+95.8% YoY). It stands at INR 10,351 crore for H1FY27 registering a YoY growth of 26.4%.
- Bank’s Operating Income registered a YoY growth of 28.7% and stands at INR 19,907 crore for the quarter. It stands at INR 35,902 crore for H1FY27 (+13.7% YoY).
- Operating expenses for the quarter stand at INR 8,477 crore, up by 7.4% YoY. It stands at INR 16,345 crore for the half year (+3.7% YoY).
- Operating Profit for the quarter rises by 50.9% YoY and stands at INR 11,430 crore, highest ever quarterly operating profit posted by the Bank. Operating Profit for H1FY27 stands at INR 19,557 crore (+23.7% YoY).
- Return on Assets (ROA) for the quarter increased by 19 bps YoY and stands at 1.26%. ROA for H1FY27 stands at 0.75%.
- Return on Equity (ROE) increased by 363 bps YoY and stands at 19.28% for Q2FY27. ROE for H1FY27 stands at 11.63%.
- Bank continues to maintain robust Asset quality with reduction in GNPA ratio by 38 bps YoY to 1.78% in Q2FY27.
- Bank’s NNPA ratio also reduced by 20 bps YoY and stands at 0.37% in Q2FY27.
- Bank’s balance sheet continues to be robust with healthy Provision Coverage Ratio (PCR). PCR with TWO improved by 144 bps YoY to 94.65%. PCR without TWO also improved by 535 bps YoY to 79.48%.
- Slippage ratio for Q2FY27 declined by 22 bps YoY to 0.69%. It stands at 0.67% for H1FY27 as against 0.90% in H1FY26.
- Bank’s Global Business stands at INR 32,57,883 crore registering a growth of 17.2% YoY.
- Global Deposits registered a growth of 16.4% YoY and Domestic Deposits were up by 16.6% YoY as of 30th September 2026.
- Domestic CASA deposits registered a robust growth of 10.4% YoY and stand at INR 5,39,515 crore.
- Bank’s Global Advances registered a growth of 18.3% YoY and Domestic advances grew by 13.5% YoY as of 30th September 2026.
- RAM portfolio grew by 18.0% YoY and share of Retail, Agri Loans and MSME loans (RAM) in domestic advances stands at 64.2% as of 30th September 2026.
- Bank delivers highest ever quarterly Net Profit of INR 6,532 crore (+35.8% YoY). Net Profit for
- H1FY27 stands at INR 7,810 crore.
- Net Interest Income (NII) for the quarter expanded by 9.0% on a YoY basis and stands at INR
- 13,026 crore. NII stands at INR 25,551 crore for H1FY27 (+9.2% YoY).
- Non-Interest Income stands for the quarter at INR 6,881 crore (+95.8% YoY). It stands at INR
- 10,351 crore for H1FY27 registering a YoY growth of 26.4%.
- Bank’s Operating Income registered a YoY growth of 28.7% and stands at INR 19,907 crore for
- the quarter. It stands at INR 35,902 crore for H1FY27 (+13.7% YoY).
- Operating expenses for the quarter stand at INR 8,477 crore, up by 7.4% YoY. It stands at INR
- 16,345 crore for the half year (+3.7% YoY).
- Operating Profit for the quarter rises by 50.9% YoY and stands at INR 11,430 crore, highest ever quarterly operating profit posted by the Bank. Operating Profit for H1FY27 stands at INR 19,557 crore (+23.7% YoY).
- Return on Assets (ROA) for the quarter increased by 19 bps YoY and stands at 1.26%. ROA for H1FY27 stands at 0.75%.
- Return on Equity (ROE) increased by 363 bps YoY and stands at 19.28% for Q2FY27. ROE for H1FY27 stands at 11.63%.
- Bank continues to maintain robust Asset quality with reduction in GNPA ratio by 38 bps YoY to 1.78% in Q2FY27.
- Bank’s NNPA ratio also reduced by 20 bps YoY and stands at 0.37% in Q2FY27.
- Bank’s balance sheet continues to be robust with healthy Provision Coverage Ratio (PCR). PCR with TWO improved by 144 bps YoY to 94.65%. PCR without TWO also improved by 535 bps YoY to 79.48%.
- Slippage ratio for Q2FY27 declined by 22 bps YoY to 0.69%. It stands at 0.67% for H1FY27 as against 0.90% in H1FY26.
- Bank’s Global Business stands at INR 32,57,883 crore registering a growth of 17.2% YoY.
- Global Deposits registered a growth of 16.4% YoY and Domestic Deposits were up by 16.6% YoY as of 30 th September 2026.
- Domestic CASA deposits registered a robust growth of 10.4% YoY and stand at INR 5,39,515 crore.
- Bank’s Global Advances registered a growth of 18.3% YoY and Domestic advances grew by 13.5% YoY as of 30 th September 2026.
- RAM portfolio grew by 18.0% YoY and share of Retail, Agri Loans and MSME loans (RAM) in domestic advances stands at 64.2% as of 30 th September 2026.
- Profitability
- Net Profit for Q2FY27 stands at INR 6,532 crore, registering a growth of 35.8% YoY. Net Profit for H1FY27 stands at INR 7,810 crore.
- Net Interest Income for Q2FY27 stands at INR 13,026 crore (+9.0% YoY). It stands at INR 25,551 crore for H1FY27 (+9.2% YoY)
- Non-Interest Income stands at INR 6,881 crore for Q2FY27 (+95.8% YoY) and at INR 10,351 crore for H1FY27, up by 26.4% YoY.
- Global Net Interest Margin (NIM) for Q2FY27 stands at 2.74%. Net Interest Margin (NIM) for H1FY27 stands at 2.76%.
- Operating Profit for the quarter rises by 50.9% YoY and stands at INR 11,430 crore. Operating Profit for H1FY27 stands at INR 19,557 crore (+23.7% YoY)
- Return on Assets (ROA) for the quarter increased by 19 bps YoY and stands at 1.26%. ROA for H1FY27 stands at 0.75%.
- Return on Equity (ROE) increased by 363 bps YoY and stands at 19.28% for Q2FY27. ROE for H1FY27 stands at 11.63%.
Asset Quality - Gross NPA Ratio improved to 1.78% in Q2FY27 from 2.16% in Q2FY26.
- NNPA ratio also reduced by 20 bps YoY and stands at 0.37% in Q2FY27
- Bank’s balance sheet continues to be robust with healthy Provision Coverage Ratio (PCR). PCR with TWO improved by 144 bps YoY to 94.65%. PCR without TWO also improved by 535 bps YoY to 79.48%.
- Slippage ratio for Q2FY27 declined by 22 bps YoY to 0.69%. It stands at 0.67% for H1FY27 as against 0.90% in H1FY26.
- Credit cost stands at 0.55% for Q2FY27. It stands at 0.42% for H1FY27.
Capital Adequacy - CRAR of the Bank stands at 16.61% in Sep’26. Tier-I stood at 14.70% (CET-1 at 14.20%, AT1 at 0.50%) and Tier-II stood at 1.91% as of Sep’26.
- The CRAR and CET-1 of consolidated entity stands at 17.01% and 14.65% respectively.
- The Quarterly Average Liquidity Coverage Ratio (LCR) (standalone) stands at 133.6% (approx.).
Business Performance - Domestic Advances of the Bank increased to INR 11,87,944 crore, +13.5% YoY.
- Global Advances of the Bank increased to INR 15,12,448 crore, +18.3% YoY.
- International Advances grew by 39.7% on a YoY basis to INR 3,24,504 crore in Sep’26.
- Domestic Deposits increased by 16.6% YoY to INR 14,83,521 crore in Sep’26.
- Global Deposits increased by 16.4% YoY to INR 17,45,435 crore.
- Domestic CASA deposits registered a growth of 10.4% YoY and stand at INR 5,39,515 crore as of 30th September 2026
- International Deposits grew by 14.9% on a YoY basis to INR 2,61,915 crore in Sep’26.
- Organic Retail Advances grew by 18.6% YoY, driven by strong YoY growth across segments such as Auto Loan (27.8%), Mortgage Loan (20.3%), Home Loan (14.6%) and Education Loan (9.9%).
- Agriculture loan portfolio grew by 19% YoY to INR 2,01,946 crore.
- Organic MSME portfolio grew by 21.3% YoY to INR 1,75,207 crore.
- Corporate advances registered a growth of 6.3% YoY and stand at INR 4,25,736 crore.
- Financial results for Quarter and Half year ended 30th September 2026
Particulars (INR crore) | Q2FY26 | Q1FY27 | Q2FY27 | YoY(%) | H1FY26 | H1FY27 | YoY(%) |
Interest Income | 31,511 | 33,211 | 35,085 | 11.3 | 62,602 | 68,296 | 9.1 |
Interest Expenses | 19,557 | 20,686 | 22,059 | 12.8 | 39,214 | 42,745 | 9.0 |
Net Interest Income (NII) | 11,954 | 12,524 | 13,026 | 9.0 | 23,388 | 25,551 | 9.2 |
Non-Interest Income | 3,515 | 3,470 | 6,881 | 95.8 | 8,189 | 10,351 | 26.4 |
Operating Income | 15,469 | 15,995 | 19,907 | 28.7 | 31,578 | 35,902 | 13.7 |
Operating Expenses | 7,893 | 7,868 | 8,477 | 7.4 | 15,765 | 16,345 | 3.7 |
Operating Profit | 7,576 | 8,127 | 11,430 | 50.9 | 15,812 | 19,557 | 23.7 |
Total Provisions (other than tax) and contingencies | 1,232 | 6,323 | 2,382 | 93.3 | 3,199 | 8,705 | -- |
of which, Provision for NPA Bad Debts Written-off | 883 | 1,043 | 1,935 | -- | 2,569 | 2,978 | 15.9 |
Profit before Tax | 6,343 | 1,804 | 9,048 | 42.6 | 12,613 | 10,852 | -14.0 |
Provision for Tax | 1,534 | 526 | 2,517 | 64.1 | 3,262 | 3,042 | -6.7 |
Net Profit | 4,809 | 1,278 | 6,532 | 35.8 | 9,351 | 7,810 | -16.5 |
Business position
Particulars (INR crore) | Sep 30 2025 | Jun 30 2026 | Sep 30 2026 | YoY (%) |
Domestic deposits | 12,71,992 | 13,81,535 | 14,83,521 | 16.6 |
Domestic CASA | 4,88,660 | 5,21,149 | 5,39,515 | 10.4 |
Global deposits | 15,00,012 | 16,33,559 | 17,45,435 | 16.4 |
Domestic advances | 10,46,506 | 11,50,906 | 11,87,944 | 13.5 |
Of which, retail loan portfolio (Organic) | 2,73,116 | 3,09,674 | 3,24,040 | 18.6 |
Global advances | 12,78,847 | 14,16,898 | 15,12,448 | 18.3 |
Key Ratios
Particulars | Q2FY26 | Q1FY27 | Q2FY27 |
NIM Global % | 2.96 | 2.77 | 2.74 |
Return on Assets (%) | 1.07 | 0.25 | 1.26 |
CRAR (%) | 16.54 | 16.30 | 16.61 |
CET-1 (%) | 13.36 | 13.90 | 14.20 |
Gross NPA (%) | 2.16 | 1.99 | 1.78 |
Net NPA (%) | 0.57 | 0.50 | 0.37 |
PCR (with TWO) (%) | 93.21 | 93.28 | 94.65 |