Time to frontload an EBLR for NBFCs and an External Benchmark Deposit Rate for Bulk deposits too; The many reasons for a 25 bps rate cut in August itself
FinTech BizNews Service
Mumbai, 3 August, 2025: The State Bank of India’s Economic Research Department has come out with a Research Report, authored by Dr. Soumya Kanti Ghosh, Group Chief Economic Advisor, State Bank of India:
Prelude to MPC Meeting: August 4-6, 2025
We expect RBI to continue frontloading with a 25 bps cut in August policy...We are living in a frontloaded world....Tariff uncertainty frontloaded...better GDP growth frontloaded for now...CPI numbers in FY27 to continue to be frontloaded with even a sub 4% number with new CPI series...even festive season is frontloaded in FY26....No point in backloading / Committing a type II error for now...
Global activity: So Far...Resilient
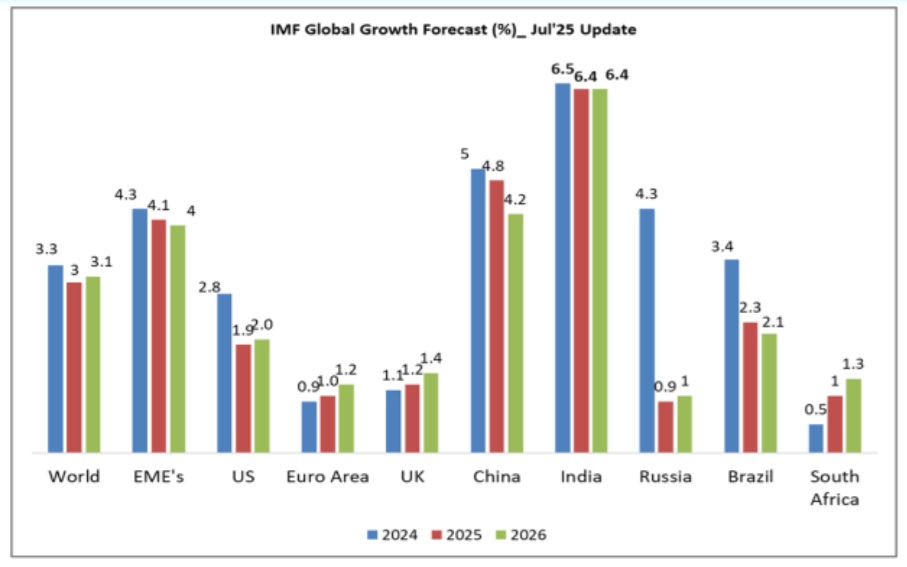
The global economy has continued to hold steady, but the composition of activity points to distortions from tariffs rather than underlying robustness • IMF has revised upwards the global growth projections in July; Global growth is projected at 3 % for 2025 and 3.1% in 2026 now
• This reflects front-loading ahead of tariffs materialization, lower effective tariff rates, better financial conditions, and fiscal expansion in some major jurisdictions
• The growth in developing economies is also revised upward from April outlook with China revised upward by 80 bps to 4.8% and India by 20 bps to 6.4%
• Global trade grew robustly in the first quarter, but high-frequency
indicators point to an unwinding of front-loading in the second quarter
Global inflation is showing mixed signs • Global inflation is expected to fall but US inflation is predicted to stay above target
• Downside risks from potentially higher tariffs, elevated uncertainty and geopolitical tensions persist
• Restoring confidence, predictability and sustainability remains a key policy priority
Evolution of 2025 Growth Forecasts (IMF WEO 2024 ONWARDS....)
❑ At 3.0% in 2025 and 3.1% in 2026, the forecasts remain below the 2024 outcome of 3.3% and the pre-pandemic historical average of 3.7%, even though they are higher than the April 25 reference forecast
❑ Basis latest revisions, Euro zone and China appear to be largest beneficiaries in immediate times of the emerging scenario as some clarity emerges through the tariff led, geo-politics accentuated upheavals (though the numbers could be a little deceptive due to front loading of trade / shipments in anticipation of higher rates)
Domestic Economy
Q1GDP could be high because of a statistical artefact with a lower deflator...Gap between Real & Nominal Growth will narrow
❑ The gap between real and nominal GDP, which was as large as 12 percentage points in Q1 FY23, dropped sharply to 3.4 percentage points in Q4 FY25
❑ Going forward, as the inflation will be historically low the deflator will be going to reduce and the gap between real and nominal will narrow...This may mask the current deceleration in growth momentum going forward
Inflation to stay below 3% in FY26 till Dec’25.......
❑ India’s CPI inflation moderated to 77-month low of 2.10% in June’25 and we believe that the upcoming July 2025 CPI inflation data is set to breach the lowest ever historical print
❑ We expect average CPI inflation for FY26 would be around 2.7% -2.9% % (RBI:3.7%) as against FY25 average of 4.6%
Vegetables are not the sole contributors of CPI moderation...
❑ Between Oct’24 and Jun’25, the headline CPI inflation declined by 410 bps to 2.1%
❑ It is foolhardy to believe that the recent moderation in inflation is altogether due to vegetable prices. Cereal, pulses and protein prices also exhibited huge moderation (103 bps). Of vegetables, top 5 vegetables accounted for 82% of total decline in overall vegetable CPI
❑ Further, the core inflation has been relatively stable and average core inflation has been at 4% for the 25-month period ended June’25
The many reasons for a 25 bps rate cut in August itself
The good thing is that going forward...the new series with a lower weightage of food and more weightage to E-Commerce could imply average CPI inflation continuing to undershoot staying below 4% even in FY27....
❑ The Consumer Price Index (CPI) is undergoing a base year revision, with the new base year set to be 2024. This revision is being carried out by the MoSPI. The new CPI series, using the 2024 base year, is expected to be published in the first quarter of 2026
❑ The new base year and weight of the items in the CPI basket is determined based on the NSO's Household Consumer Expenditure Survey (HCES) conducted in 2023-24
❑ Based on the HCES survey 2024, we expect a new CPI series with food weight may come around 43% and this will lead to ~20 to ~ 30 bps reduction in headline CPI
Why Delayed Easing /Beyond August could be a costlier error today ?
❑ With inflation having decisively eased and remained within the RBI's tolerance band for several months, maintaining a restrictive policy stance risks exacerbating output losses that are neither easily reversible. Monetary policy operates with lags, and postponing a rate cut until inflation falls further or growth weakens more visibly could result in deeper and more persistent economic damage. At this point, the marginal benefit of waiting is low, while the cost of inaction in terms of forgone output, investment sentiment is likely to be significant
❑ Central Banks operate under the constraint of a dual mandate of Price stability and Output stabilization. The standard Central Bank Loss function (Quadratic Loss Function) is given by
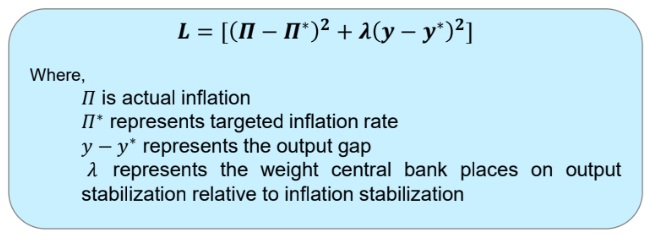
It will be a mistake to commit Type 2 error today by not cutting rates as inflation will continue to remain rangebound even in FY27
❑ Monetary policy can be statistically framed as hypothesis testing problem
H0: Inflation undershooting is transitory
HA: Inflation undershooting is not transitory
The expected loss from monetary policy decisions under uncertainty can be expressed as:
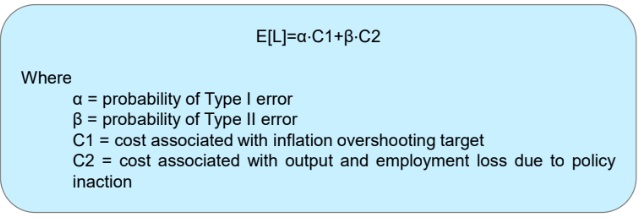
Empirical Evidence ( Ball(1994), Blinder(1998) ) suggests that missed easing cycles have a more damaging impact than easing early i.e.
C2>C1 and hence expected loss from easing is lower than expected loss from non-easing underscoring the asymmetries in policy error costs. Thus, a cut now would minimize expected loss
Type-I error: A Type I error occurs when the central bank rejects the null hypothesis, believing that inflation is persistently undershooting and thus cuts rates but in reality the inflation undershoot was temporary or due to noise.
Type-II error: A Type II error occurs when the central bank fails to reject the null hypothesis, assuming that the inflation undershoot is temporary, and hence does not cut rates — but in reality, inflation remains persistently low and output gap continues to weaken....
Type II error is often considered more harmful in applied statistics because it reflects low test power—failing to detect a true effect—which can lead to costly inaction. We must avoid Type 2 error and cut now...
Why Delayed Easing Could be a costlier error today?
Risks of Type-II Error (Amplification of Future costs)
Inflation- Already at 77-month low of 2.10% and likely to decline even further...
If inflation later rises, the central bank may have to tighten, which would compound the output gap that could have been narrowed earlier through timely easing
India–US trade deal is now quite uncertain and thus delaying the rate cut could add to uncertainty. Cutting rates now would send a clear signal and reduce confusion at a time when external changes are completely unexpected
Rate cut now will minimize Central Bank Loss Function
Testing for Structural Break indicate Feb-25 as turning point for home loan portfolio of banks
❑ RBI has slashed repo rate by 100 bps in last months (since Feb’25) and the home loan rate linked to EBLR has also declined by the same magnitude. This we believe has given fillip to the home loan portfolios of banks
❑ We applied the Bai-Perron multiple breakpoint test to identify potential structural shifts in the relationship over time without pre-specifying any break dates...This method systematically searches for changes in the regression coefficients by testing all statistically valid partitions of the data. By doing so, it allows for the endogenous detection of breakpoints where the underlying dynamics of the variable may have changed due to policy, market, or macroeconomic factors
❑ Our analysis revealed a statistically significant structural break in February 2025 in housing loan data, suggesting a clear change in regime.. This result indicates home loans from banks has shifted meaningfully around this time the first cut by RBI....
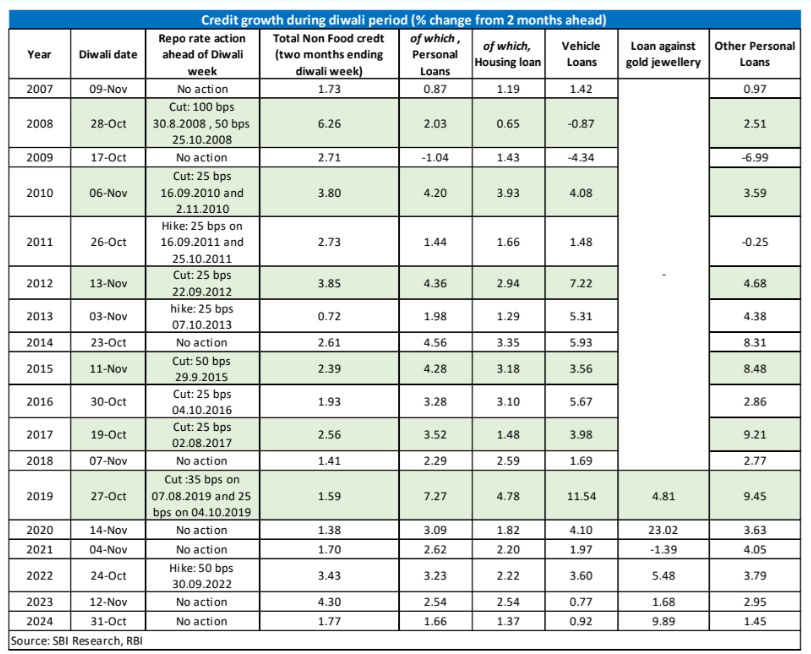
A frontloaded rate cut in August could bring early Diwali...Even festive season is frontloaded in FY26.....
❑ We have analyzed past trends of credit growth around Diwali period with respect to repo rate cut
❑ We found that any repo rate cut ahead of Diwali boost credit growth more vigorously till Diwali
❑ For example, a 25-bps repo rate cut in Aug’17 resulted in an incremental credit growth of Rs 1956 billion till the ending of Diwali, of which almost 30% in personal loans
❑ Being one of the biggest festivals in India, a low-interest rate regime before pre-Diwali leads to better credit growth...cutting now will result in frontloaded transmission too
Credit Growth is slowly picking up but expected to be muted in FY26
❑ SCB’s credit growth slowed to 9.8% as on July 11, 2025, compared to last year growth of 14.0%. As data of HDFC merged with HDFC Bank w.e.f. 01 July 2023, going forward, the impact of merger on credit growth will be nullify
❑ During Apr-July, credit grew by Rs 2.19 lakh crore (1.2% YTD), compared to last year growth of Rs 3.79 lakh crore (2.3% YTD), while deposits grew by Rs 7.45 lakh crore (3.3% YTD), compared to last year growth of Rs 7.01 lakh crore (3.4% YTD)
❑ The higher returns on term deposits led to higher accretion in such deposits as compared to other type of deposits; the share of saving deposits declined to 29.1% in March 2025 as compared to 30.8% a year ago and 33.0% two years ago. Consequently, the share of term deposits in total deposits rose to 62%...CASA declined to 38%
❑ By looking at the trend growth, deposits may grow in the range of 12-13%, while credit may grow by 10%-11% during FY26
Liquidity surplus averages to Rs 2.92 Lakh crore in Jun-July’25
❑ Daily liquidity averaged Rs 2.92 Lakh crore surplus in Jun- Jul’25 against Rs 1.5 lakh crore surplus in Apr-May 25, mainly because of RBI dividend transfer. The government cash balance average also increased from Rs 1 lakh crore in Apr-May to Rs 2.70 lakh crore in Jun-Jul 25
❑ Core liquidity surplus also jumped to Rs 5.63 Lakh crore surplus in Jun-July 25 from Rs 2.57 Lakh crore in Apr-May period (average of 2.42 % of NDTL from 1.10 % of NDTL)
❑ RBI has also conducted VRRR auctions in Jun-Jul-Aug (Till Date) 2025 at the average rate 5.49%, mopping Rs 10.08 Lakh cr cumulatively.
❑ On a review of current and evolving liquidity conditions, RBI decided to stop daily VRR auctions, with effect from June 11, 2025. The daily VRR auctions till 10th June amounted to Rs 3.5 lakh cr, and long-term repo of Rs 25000 cr
❑ Further, when the call rate increased to 5.73% owing to tax outflows on 23 July’25, particularly GST payments which pulled large sums of money out of the banking system. This marks the first time since March that overnight funding costs breached the policy rate. RBI started liquidity injection of Rs 51 bn for two days after the sudden spike in money market rates.
❑ Durable liquidity is likely to remain in surplus in FY26, supported by several factors, like OMO purchase (Rs 2.39 lakh cr in Apr May 25), RBI’s dividend transfer, estimated BOP surplus of around USD 20-25 bn in FY26
Transmission has been faster: Expect another 25 bps Repo Rate cut in FY26
❑ From the previous interest rate cycles, it is evident that banks are able to transmit more to Liabilities (Deposits) faster in tightening phase (May’22 to Jan’25), compared to easing phase (Jan’19 to Apr’22)
❑ In the current easing phase (Feb-June 2025), in response to the 100 bps cut in policy repo rate, banks have revised their repo linked EBLRs up by same magnitude. While many banks have reduced their MCLR rates in the range of 10-65 bps, despite having a longer reset period and is referenced to the cost of funds. PSBs reduced lending rates faster than Pvt banks
Why MCLR takes time to Reset...Time to mull over also a EBLR for NBFCs?....
❑ As per RBI’s circular, (i) all floating rate rupee loans sanctioned and renewed w.e.f. April 1, 2016 shall be priced with reference to the MCLR which will be the internal benchmark and (ii) all new floating rate personal or retail loans (housing, auto, etc.) and floating rate loans extended by banks to Micro and Small Enterprises from October 01, 2019 and (iii) floating rate loans to Medium Enterprises from April 01, 2020 shall be benchmarked to one of the external bench-marks: (i) RBI repo rate or (ii) GoI T-bill yields or (iii) any other benchmark market interest rate published by the FBIL
❑ The MCLR comprise of (a) Marginal cost of funds; (b) Negative carry-on account of CRR; (c) Operating costs; (d) Tenor premium. Out of the 4 components, negative carry-on account of CRR is changed only when RBI change CRR and Operating cost is mostly fixed in a year, as banks followed their annual results. On the other hand, tenor premium is the loan commitments with the tenor, i.e., longer the loan period, higher is the premium as more risk associated
❑ Only the marginal cost fund changes with the change in repo rate, which is calculated as Marginal cost of funds = 92% x Marginal cost of borrowings + 8% x Return on networth
❑ Interestingly, many banks rarely borrow from RBI’s LAF window to fund the credit growth. So, the change in repo rate don’t change their cost of funds directly
❑ As CASA is around 40%, so the change in deposits rate impacts only 60% of time deposits, so if banks change 100 bps in term deposits rate, which will translate a max of 60 bps to cost of deposits. So, a 100 bps change in EBLR and 60 bps change in Deposits rate may raise ALM issues..
❑ Further, almost all major banks have already reduced their TD rates in the range of 30-70 bps since February 2025. Many banks, including HDFC, AXIS, ICICI Bank and SBI, are strategically reducing savings interest rates by 20-25 basis points to lower the cost of funds to match the transmission in lending rates. Currently, the savings deposit rates of some banks are prevailing at a historical low, since their de-regulation in 2011
❑ Further deposit rate cuts will depend on the appetite of banks to retain their deposit base...it is always a challenge to maintain a stable deposit franchise...
....Is it the time for External Benchmark Term Deposits Rate (EBTDR) / Flexible Bulk Deposit rates?....
❑ As per RBI’s FSR, June 2025 Report, the share of floating rate loans in total gross advances of 14 selected banks, accounting for around 75.7% of the assets of SCBs (excluding SFBs and RRBs). On the other hand, deposits, which are at fixed rate, holds around 78% of the total assets of SCBs
❑ So, this creates problem for Banks in transmitting the change in policy rates, as deposits are mostly fixed, while loans are at variable rate.
Further, retail investors borrow at floating rates, but invest at a fixed rate, and are therefore exposed to high-interest rate risk in a rising interest rate regime. Since, these investors cannot hedge their interest rate risk, investing in floating-rate products appears to be the only alternative to lower this asset-liability mismatch
❑ We believe time has come for RBI to introduce External Bench-Mark Term Deposits Rate (EBTDR), which will be helpful to the banker in adjusting assets-liability mismatch, as the customers are taking short-term deposits (due to higher rate) and making long-term loans.. However, this could be an option only for Bulk Deposit rates as Retail deposit rates have probably reached the lowest levels...
❑ A few banks, including SBI, has already tested floating rate term deposits but not successful. So, we believe it will be successful only if RBI would issue guidelines to banks directing to mobilize fresh deposits only at floating rates
Bank credit to remain low as corporates are using other avenues of funding in low-interest rate regime
❑ Using resource flow data of past 8 years, we have observed that in the time of low-interest rate regime (like during FY21/FY22), the corporate typically use other sources of funding rather than bank credit
❑ The same trend is expected to visible now when the share of incremental bank credit in total resource flow is expected to down from 31.3% in FY25 to 22% in Q2 FY26
❑ Yearly headline credit growth is currently running at 9.5%(June’25), Resource flow excl bank credit is running at 15.6% and credit to MSME at 21.8%