Indian Banking Sector: A Trend Analysis; Gujarat, West Bengal, Madhya Pradesh, Andhra Pradesh & Karnataka etc. have witnessed movement of deposits from banks towards financial markets at a faster pace
FinTech BizNews Service
Mumbai, 12 January 2026: The State Bank of India’s Economic Research Department has come out with an insightful Research Report on the Indian Banking Sector. The report has been authored by Dr. Soumya Kanti Ghosh, Group Chief Economic Adviser, State Bank of India.
 Deposits surged from Rs85.3 lakh crore to Rs241.5 lakh crore and advances from Rs67.4 lakh crore to Rs191.2 lakh crore during FY15–FY25…signalling scale expansion of the banking system… speed is much faster in the case of advances indicating robust financial intermediation …Credit-Deposit (C-D) Ratio at 79% in FY25..Indan Households across states are turning from savers to investors…Juxtaposing incremental deposits between FY20-25 & incremental investors during the same period reveals states such as Gujarat, West Bengal, Madhya Pradesh, Andhra Pradesh & Karnataka etc. witnessing movement of deposits from banks towards financial markets at a faster pace.
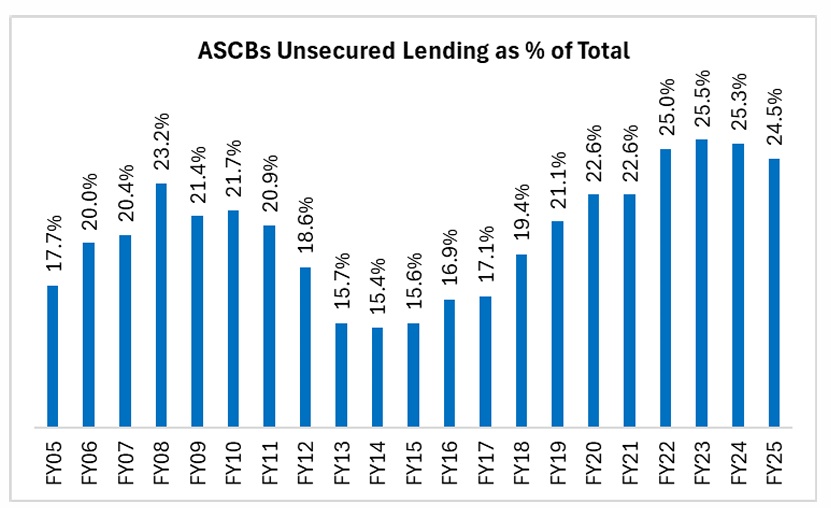
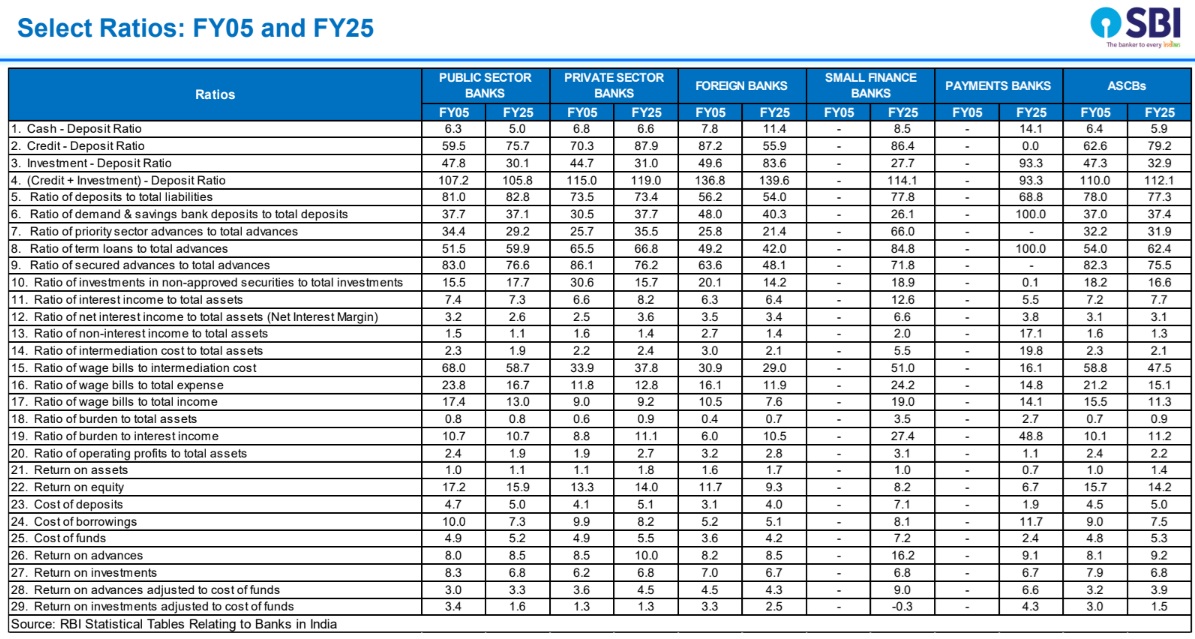
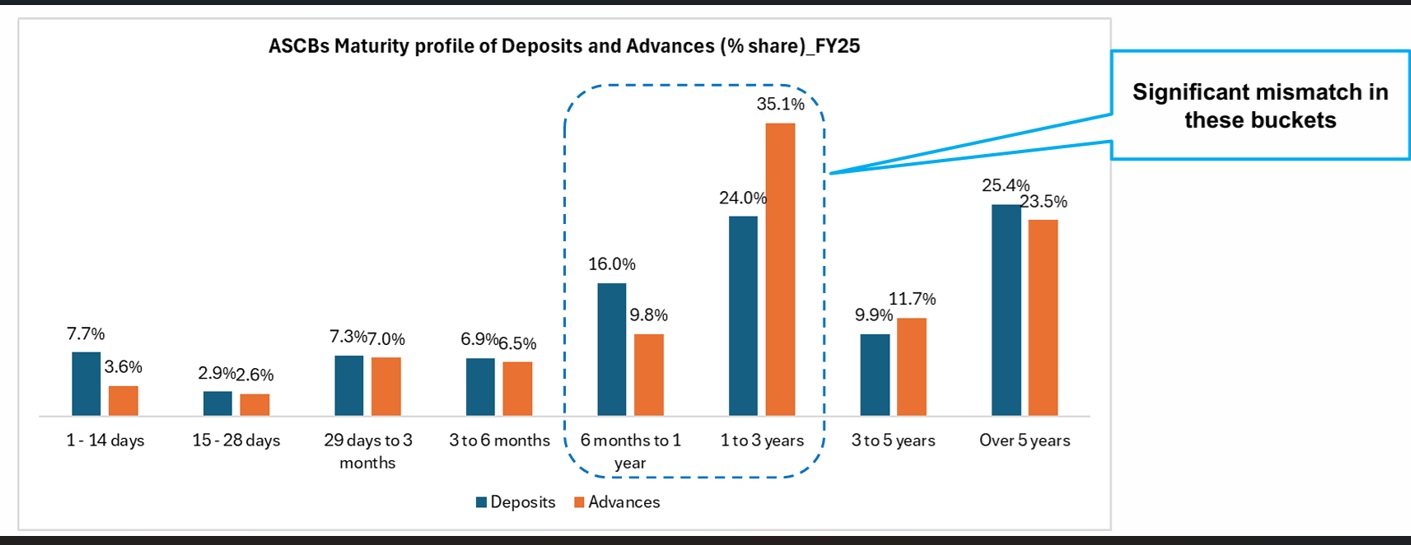
Indian banks have exhibited strong post-pandemic balance sheet revival…Bank asset growth rebounded sharply after FY21, rising from 77% of GDP to 94% by FY25…reflecting renewed credit intermediation and financial deepening ❑ Deposits and advances expanded manifold over two decades…Deposits surged from Rs18.4 lakh crore to Rs241.5 lakh crore and advances from Rs11.5 lakh crore to Rs191.2 lakh crore during FY05–FY25…signaling scale expansion of the banking system… but the speed is much faster in the case of advances…Credit-Deposit (C-D) Ratio increased from 69% in FY21 to 79% in FY25 ❑ Public Sector Banks’ (PSBs) market share shows continued revival…After a secular decline since FY08, PSBs gradually reclaiming advances market share…indicating balance sheet repair and renewed lending appetite ❑ CASA stability masks divergent trends across bank groups…While overall CASA ratios remained around 37%, private banks strengthened CASA shares whereas foreign banks witnessed erosion ❑ There is gap between maturity profile of share of deposits and advances for 6 months to 1 year and 1-3 year time bucket…The 35% share of advances in 1-3 years bucket indicating increasing tendency of pre-payment among borrowers ❑ Sharp rise in unsecured lending raises risk sensitivity…Unsecured advances expanded from Rs2 lakh crore to Rs46.9 lakh crore, with share rising to 24.5% in FY25 from 17.7% in FY05 …underscoring potential credit risk accumulation…
Capital adequacy improved across most PSBs…CRAR levels increased for almost all PSBs between FY21 and FY25…While the CRAR level is high for Private sector banks, a few of them (8 out of 21) seen decline in in FY25 over FY21 ❑ Exposure to sensitive sectors continues to rise…and currently reached Rs 50 lakh crore (almost 27% of total advances)..Of the total exposure to sensitive sectors (FY25), 50% share is attributed to Private sector banks followed by PSBs ate 47% ❑ Banking employment nearly doubled over two decades…Total employees increased from 8.6 lakh to 18.1 lakh, with private banks accounting for 46% and PSBs 42%.... Officer share rose from 36% to 76%…indicating skill intensification and preference for higher-value roles ❑ ASCBs contingent liabilities has soared at an unexceptional pace and grew from Rs 28.3 lakh crore in FY05 to Rs 505.5 lakh crore (an increase of almost 18x)..the share of liability on account of outstanding forward exchange contracts is almost 93% of total contingent liabilities ❑ Threshold regression reveals non-linear leverage–profitability dynamics…. Our threshold regression estimates indicate optimum CD ratio at 76–80% for PSBs and private banks and 65–70% when foreign banks are included…beyond which profitability gains diminish sharply indicating excessive leverage reduces the incremental profitability of banks.
With the financialization of the economy, India’s credit-deposit (CD) ratio has been increasing continuously since 2000-01 from 53% to 82% as of 15 Dec 2025.. The incremental CD Ratio numbers, which crossed 100% in a number of instances…shows the increasing demand for credit, despite lean deposits ….Since 1950-51, there have been 8 instances (FYs), when the incremental CD ratio has crossed 100% and in 2005-06 it touched 99% ❑ Persistent regional disparities in credit deployment…Southern, Western and Northern regions dominate high CD ratios, while Eastern and North-Eastern regions lag…indicating uneven development…Some big States like Odisha, Bihar, Jharkhand & West Bengal…CD ratio is below 52%... By looking the bracket-wise CD ratio, there are 75 districts whose CD ratio is above 150 and 226 districts are there whose CD ratio is below 50…around 46% of districts CD Ratio is within 50-100…Southern Region districts CD ratio is better compared to Other Regions ❑ District-wise concentration indices, reveal the top 10 districts holds around 43% of deposits and 49% of credit. While the top 100 districts hold deposits of 75% and credit of 77%...The rest of 643 districts holds business of around 25%...In the top-25 districts of deposits, who are not in the top-25 credit districts are : Nagpur, Patna, North-24 Parganas, and Trivandrum….Similarly, there are 4-districts, namely Chandigarh, Indore, Ludhiana and Raipur are in the top 25-credit districts but not in the top 25-deposits districts.