Performance highlights of key diversified financial companies
FinTech BizNews Service
Mumbai, 19 November, 2026: The latest Kotak Institutional Equities report on Diversified Financials point to a mixed performance of NBFCs in 2QFY27:
A mixed bag: 2QFY27 review
NBFCs reported a mixed performance in 2QFY27, with growth accelerating and asset quality remaining broadly stable/improving. However, most vehicle finance and rural-focused lenders offered measured guidance amid a weaker monsoon. Despite some emerging concerns around gold loans, the broader asset quality and growth outlook remains resilient, reinforcing our constructive stance. Bajaj Finance/Finserv, MMFS and Shriram remain our preferred picks, while Aadhar and Home First are our favored names among affordable HFCs.
NBFCs sustain strong growth
NBFCs continued to report strong loan growth, with affordable HFCs growing 16-27% yoy and the rest of the pack at 14-27%, excluding LICHF (up 5% yoy). Key lenders that accelerated growth included mostly the urban-focused multi-product players—Bajaj Finance (loan growth up 200 bps yoy) and Tata Capital (up 300 bps yoy). The rural/vehicle finance-focused NBFCs also gained momentum, with Chola and Shriram Finance accelerating by 200-300 bps, albeit largely driven by non-motor segments. Disbursement growth remained strong at 22-47% for NBFCs excluding LICHF. SBFC reported 5% yoy growth in its MSME business, while Aditya Birla standalone growth stood at 12%, constrained largely by the rundown of its wholesale business.. As highlighted in Exhibit 5, our growth forecasts remain broadly unchanged.
NIM trends mixed; fee income at risk
Trends in NIM were mixed with yoy contraction for most. Yields were nearly flat for the past two quarters but down yoy, reflecting rate transmission and intense competition. The cost of funds declined sharply for most players in 4QFY26 and inching up since then. With increase in repo rates and MCLR by select banks, we expect borrowing costs to inch up. Many NBFCs, unlike the last cycle, have moved to monthly from annual reset; this means that the MCLR transmission may be faster. Our NIM forecasts have expanded for most players for FY2027E, as companies step up to raise lending rates following the festive season; generally the urban-focused players are better placed on fixed/floating mix of asset and liabilities (see Exhibit 23). We have cut our fee income estimates primarily to reflect YTD trends and, more importantly, lower insurance business, as commissions on credit protect may come off; we have shaved off about 25-30% of fees earned from insurance.
Asset quality: Some concerns emerge
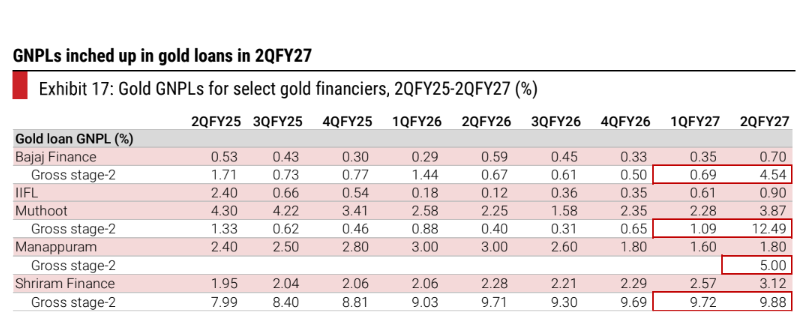
After a convincing performance for the past two quarters, some asset quality stress is back in discussion. Most lenders, excluding Aptus and Shriram Finance, reported stable/decline in stress loans and/or credit costs. Rural-focused lenders have raised some flags of weak performance in select regions, mostly toward the end of the quarter, due to a weak monsoon; as we move to the next quarter, we understand that the stress is very selective but still need to remain watchful. Gold loans reported some stress, mostly in gross stage-2 due to EMI products sold by lenders (see Exhibit 17); having said that, the impact of recent fall in gold price remains a monitorable, especially for the new players.
Performance highlights of key diversified financial companies: 2QFY27
4 | Aadhar. Aadhar reported PAT of Rs3.1 bn in 2QFY27, up 16% yoy and 1% above our estimate. NII increased 17% yoy, supported by 18% yoy AUM growth, while calculated NIM improved 13 bps qoq to 8.1%. Operating expenses increased 18% yoy, broadly in line with AUM growth, with the cost-to-AAUM ratio increasing marginally to 3.0% from 2.9% in 1QFY27. Credit cost moderated to around 30 bps from 41 bps in 1QFY27, moving closer to management’s guidance of 23-25 bps. Stressed loans increased to 4.9% from 4.7% in 1QFY27, driven by gross stage-2 increasing around 29 bps qoq to 3.55%. Gross stage-3 increased 4 bps qoq to 1.4%, although it improved 12 bps yoy, while write-offs moderated to negligible levels from 0.1% in 1QFY27. |
4 | Aavas. Aavas reported PAT of Rs1.8 bn, up 11% yoy and 4% below our estimate. NII increased 13% yoy, driven by 16% AUM growth, partly offset by a 10 bps yoy compression in calculated NIM to 6.9%. Disbursements increased 21% yoy and 17% qoq to Rs18.9 bn, led by 35% yoy growth in mortgage loans and 12% yoy growth in home loans. Operating expense growth was moderate at 6%, well below AUM growth, leading to a 29 bps yoy and 10 bps qoq decline in the cost-to-AAUM ratio to 3.0%. Credit cost remained benign at 20 bps, broadly stable qoq, although up 7 bps yoy. |
4 | Aditya Birla Capital. ABCL’s lending businesses are on a roll; the NBFC delivered 26% yoy and 5% qoq AUM growth, driving 35% growth in earnings to Rs12.3 bn on a standalone basis. The HFC delivered 50% yoy and 11% qoq AUM growth, driving 73% yoy earnings growth to Rs2.6 bn. Asset-quality parameters improved further; NBFC credit cost was 0.9%, down 24 bps yoy and 11 bps qoq, with gross stage-3 at 1.3%. HFC credit cost remained low at 0..2%, with gross stage-3 at 0.4%. We see ABCL increasingly curtailing risk while managing growth and RoA; despite the rising share of retail/unsecured loans, NIMs have remained nearly stable. Credit cost has declined to a seven-year low at ABCL, aided by consistent pruning of portfolio risk, apart from a favorable macro environment. |
4 | Aptus. Aptus reported PAT of Rs2.7 bn in 2QFY27, up 18% yoy and 3% above our estimate. NII increased 23% yoy, supported by 20% yoy AUM growth, while calculated NIM expanded 89 bps yoy and 37 bps qoq to 11.8%. Disbursements grew 20% yoy, although the repayment rate increased sharply to 18.3% from 15.6% in 1QFY27, partly limiting AUM growth. Operating expenses increased 30% yoy, above AUM growth, leading to a 20 bps yoy and 14 bps qoq increase in the cost-to-AAUM ratio to 2.8%. Credit cost remained elevated at 0.7%, up 10 bps yoy and 6 bps qoq. Stressed loans increased to 8.3% from 6.5-7.5% over the previous four quarters, despite the sale of Rs8.9 bn of stressed loans to an ARC, with the deterioration primarily driven by the NBFC subsidiary’s secured MSME/LAP portfolio. Gross stage-2 increased to 5.4%, while gross stage-3 rose to 3.5%. |
4 | Bajaj Finance. Bajaj Finance reported PAT of Rs63.7 bn in 2QFY27, up 29% yoy, but 2% below our estimate, largely due to higher-than-expected provisions. NII increased 24% yoy, supported by 26% yoy AUM growth, while calculated NIM declined 12 bps yoy and 9 bps qoq to 9.4%. Operating expenses increased 23% yoy, slightly below AUM growth, leading to an improvement in the cost-to-AAUM ratio to 3.7%. Reported credit cost moderated to 1.5% from 1.8% in 2QFY26 and was broadly stable qoq; excluding Rs3.4 bn of prudent management and macroeconomic provisions, credit cost was lower at 1.32%. Gross stage-2 and stage-3 assets increased to 2.02% of loans from 1.87% qoq, largely reflecting a Rs10.5 bn transitional increase in gold-loan stage-2 assets from discontinued short-tenor schemes. Excluding this movement, stage-2 and stage-3 assets improved to 1.88% from 1.90% in 1QFY27. |
4 | Bajaj Housing Finance. Bajaj Housing Finance reported PAT of Rs7.6 bn in 2QFY27, up 18% yoy and 5% above our estimate. NII increased 10% yoy, supported by 25% yoy AUM growth, although calculated NIM declined 38 bps yoy to 3.1%. Calculated NIM improved 8 bps qoq, as yields increased 5 bps and the cost of borrowings declined 7 bps, partly reflecting the benefit of swapping fixed-rate borrowings for floating-rate borrowings. Fee and commission income increased 84% yoy, while assignment income doubled yoy. Operating expenses increased 12% yoy, slower than AUM growth, leading to a 7 bps yoy decline in the cost-to-AAUM ratio to 0.6%. Credit cost remained benign at 0.1%, down 7 bps yoy. Asset quality remained stable, with gross stage-2 and gross stage-3 unchanged qoq at 0.3% each, while stage-3 provision coverage improved to 59.8% from 58.5% in 1QFY27. |
4 | Cholamandalam. Chola reported PAT of Rs16.3 bn in 2QFY27, up 41% yoy and 3% above our estimate. NII increased 24% yoy, supported by 25% yoy growth in loans under management, while calculated NIM on on-balance-sheet loans was broadly stable yoy at 7.2%, although it declined 12 bps qoq. Operating expenses increased 22% yoy, slower than AUM growth, leading to a marginal improvement in the cost-to-AAUM ratio to 3.28% from 3..31% in 2QFY26. Credit cost moderated to 1.5% from 1.8% in 2QFY26 and was around 25 bps below our estimate, driving the earnings beat. Asset-quality trends improved marginally, with gross stage-3 declining 4 bps qoq and 10 bps yoy to 3.2%. Stressed loans remained stable qoq at 7.0% and declined 72 bps yoy. |
4 | Five Star. Five-Star reported PAT of Rs3.0 bn in 2QFY27, up 5% yoy and 2% above our estimate; adjusted for a Rs188 mn reversal of excess tax provisions, PAT was broadly flat yoy. NII increased 12% yoy, supported by 14% yoy AUM growth, while reported NIM remained broadly stable yoy at 19.9%, although it declined 10 bps qoq. Disbursements increased sharply by 74% yoy and 39% qoq to a record Rs20.8 bn, driving an acceleration in AUM growth from 10% yoy in 1QFY27. Operating expenses increased 39% yoy, materially above AUM growth, as the company continued to invest in collections infrastructure; consequently, the cost-to-AAUM ratio increased 145 bps yoy and 34 bps qoq to 7.6%. Credit cost remained elevated at 1.81%, broadly stable qoq but 20 bps higher yoy. Early delinquencies improved, with the 1+ dpd ratio declining 148 bps qoq and 311 bps yoy to 15.2%, while 30+ dpd declined 88 bps qoq and 67 bps yoy to 11.5%. However, gross stage-3 remained broadly stable qoq at 3.48% and was 84 bps higher yoy, while higher write-offs continued to weigh on credit costs. |
4 | Home First. Home First reported PAT of Rs1.7 bn in 2QFY27, up 29% yoy and 3% above our estimate. NII increased 29% yoy, supported by 27% yoy AUM growth and a 22 bps yoy expansion in calculated NIM. Disbursements grew 32% yoy, while AUM increased 6% qoq to Rs180.1 bn. Calculated NIM moderated 10 bps qoq to 7.4%, with yields and the cost of borrowings broadly stable qoq at 13.5% and 8.0%, respectively. Operating expenses increased 19% yoy, below AUM growth, leading to a 14 bps yoy and 23 bps qoq improvement in the cost-to-AAUM ratio to 2.4%. Credit cost remained broadly stable at around 0.4% annualized, declining 9 bps yoy and 3 bps qoq. Asset quality improved, with gross stage-3 declining 19 bps yoy and 3 bps qoq to 1.7%, while gross stage-2 remained stable at 1.4%. Overall stressed loans moderated to 4.9% from 5.0% in 1QFY27 and 5.8% in 2QFY26. |
4 | India Shelter. India Shelter reported PAT of Rs1.46 bn in 2QFY27, up 20% yoy and broadly in line with our estimate. Total income increased 24% yoy, supported by healthy NII growth and 23% yoy AUM growth. Disbursements increased 21% yoy, while AUM grew 6% qoq to Rs119.97 bn. Reported spread remained stable qoq at 6.6%, with yields and the cost of borrowings unchanged at 14.8% and 8.2%, respectively. Operating expenses increased 27% yoy, above AUM growth, although the cost-to-AAUM ratio remained broadly stable at 4.0%. Credit cost increased to 0.6% from 0.5% in 1QFY27. Asset quality improved marginally, with gross stage-2 declining to 3.9% from 4.1% in 1QFY27 and gross stage-3 remaining unchanged qoq at 1.5%. Consequently, stressed loans moderated to 5.6% from 5.7% in 1QFY27. |
4 | L&T Finance. L&T Finance reported PAT of Rs9.8 bn in 2QFY27, up 33% yoy and broadly in line with our estimate. NII increased 34% yoy, supported by 28% yoy AUM growth, while NIM expanded 46 bps yoy and 40 bps qoq to 8.9%. The sequential NIM improvement was supported by a 5 bps increase in yields to 14.9% and a 39 bps decline in the cost of funds to 6.6%. Operating expenses increased 28% yoy, broadly in line with AUM growth, with the cost-to-AAUM ratio stable yoy at 4.1%. Credit cost remained elevated at 2.5%, broadly stable yoy and qoq, but 8 bps above our estimate. Asset quality improved, with gross stage-3 declining 6 bps qoq to 2.4% and gross stage-2 remaining stable qoq at 1.6%. Stage-3 provision coverage improved to 70.5% from 69.6% in 1QFY27. |
4 | LICHF. LIC Housing Finance reported PAT of Rs15.1 bn, up 12% yoy and 10% above our estimate, driven by provision write-backs; core PBT was broadly in line. NII increased 2% yoy and was 3% above our estimate, despite modest loan growth of 5% yoy. Overall disbursements increased 11% yoy and 21% qoq to Rs181 bn, driven by retail disbursements, which grew 10% yoy and 35% qoq. NIM declined 5 bps yoy and 1 bp qoq to 2.6%, but was 7 bps above our estimate. Operating expenses increased 8% yoy, although they declined 4% qoq and were broadly in line with our estimate. Credit cost was a write-back of 11 bps, versus credit cost of 22 bps in 2QFY26 and a write-back of 20 bps in 1QFY27. |
4 | Mahindra Finance. Mahindra Finance reported PAT of Rs8.8 bn in 2QFY27, up 55% yoy and 6% above our estimate, supported by higher fee/non-interest income and lower provisions. Core PBT increased 17% yoy and was 2% above our estimate. NII increased 13% yoy, supported by 15% yoy loan growth, while NIM was broadly stable yoy at 6.7%, although it declined around 37 bps qoq. Operating expenses increased 13% yoy, slower than loan growth, leading to a marginal improvement in the cost-to-average loans ratio to 2.9%. Credit cost moderated sharply to 1.8% from 2.4% in 2QFY26, although it increased from 1.7% in 1QFY27. Asset quality improved yoy, with gross stage-3 declining to 4.8% from 5.5% in 2QFY26 and remaining broadly stable qoq. Net stage-3 improved to 2..9% from 3.5% in 2QFY26, while the provision coverage ratio increased to 41% from 38% a year ago. |
4 | Muthoot Finance. Muthoot Finance reported standalone PAT of Rs29.8 bn, up 27% yoy and 6% above our estimate. Core PBT increased 40% yoy and was 17% above our estimate. NII increased 34% yoy, supported by 42% yoy AUM growth, while calculated NIM expanded ~150 bps qoq to 11.9%, despite declining 75 bps yoy. Calculated yield increased 148 bps qoq to 19.4%, while the cost of borrowings declined 15 bps qoq to 8.6%. Operating expenses increased moderately by 10% yoy, leading to a ~64 bps yoy decline in the cost-to-AAUM ratio to 2.2%. Credit cost increased sharply to 1.14% from 0.12% in 1QFY27, largely due to strong loan growth and an increase in stage-3 loans. Gross stage-3 increased to 3.9% from 2.3% in 1QFY27, while stage-2 rose sharply to 12.5% from 1.1%. The deterioration largely reflected borrower-level asset classification and initial servicing issues in the new monthly-interest and shorter-tenure products. Management viewed the increase as operational rather than reflective of underlying credit stress, supported by principal LTVs of ~53% for actual stage-3 loans and ~72% for stage-2 loans. |
4 | SBFC. SBFC reported PAT of Rs1.39 bn in 2QFY27, up 27% yoy and 1% above our estimate. NII increased ~27% yoy, broadly tracking 27% yoy AUM growth, while calculated NIM moderated around 25 bps qoq to 10.3% but remained broadly stable yoy. Overall AUM increased 6% qoq to Rs125.9 bn, led by 71% yoy growth in the gold-loan portfolio and 18% yoy growth in secured MSME loans. Operating expenses increased 17% yoy, slower than loan growth, supporting 31% yoy growth in core PBT. Credit cost remained elevated at 1.4%, declining around 9 bps qoq but increasing around 7 bps yoy. Overall stressed loans increased 12 bps qoq to 6.8%, driven by a 20 bps rise in gross stage-2 to 3.4%, partly offset by a 2 bps decline in gross stage-3 to 2.6% and a 5 bps moderation in annualized write-offs to 0.7%. The 1+ dpd ratio remained broadly stable qoq at 9.2%, while overall ECL coverage increased 6 bps qoq to 2.0%. |
4 | Shriram Finance. Shriram Finance reported PAT of Rs36.8 bn in 2QFY27, up 59% yoy and 2% above our estimate, while core PBT was 8% above our estimate. NII increased 40% yoy, supported by 17% yoy AUM growth and a 176 bps yoy expansion in NIM to 10.5%. NIM also expanded 47 bps qoq, aided by the rundown of excess liquidity, higher yields and lower incremental funding costs. Operating expenses increased just 4% yoy, well below AUM growth, leading to a 30 bps yoy and 24 bps qoq decline in the cost-to-AAUM ratio to 2.5%. Credit cost increased to around 2.3% from 1.9% in 1QFY27 and was 39 bps above our estimate, partly offsetting the operating leverage benefit. Gross stage-3 remained broadly stable qoq at 4.65%, versus 4.64% in 1QFY27, while gross stage-2 increased marginally to 7.04% from 6.96%. Stage-3 provision coverage improved to 51.5% from 51.0% in 1QFY27 and 46.7% in 2QFY26. |
4 | Tata Capital. Tata Capital reported PAT of Rs18.3 bn in 2QFY27, up 64% yoy and 15% above our estimate, supported by income from private funds and lower provisions. Core PBT increased 29% yoy and was broadly in line with our estimate. NII increased 23% yoy, supported by 26% yoy AUM growth. AUM increased 6% qoq to Rs3.08 tn; excluding motor finance, AUM grew 32% yoy and 7% qoq to Rs2.84 tn, led by strong growth in SME and corporate loans. Calculated NIM moderated 7 bps yoy and 9 bps qoq to 5..0%, as stable sequential yields were offset by a 13 bps qoq increase in the cost of borrowings. Operating expenses increased moderately by 10% yoy, well below AUM growth, leading to a 29 bps yoy and 8 bps qoq improvement in the cost-to-AAUM ratio to 2.2%. Credit cost moderated 43 bps yoy and 9 bps qoq to 0.9%, with provisions declining 17% yoy. Asset quality remained broadly stable sequentially; gross stage-3 was stable qoq at 1.9% and improved 35 bps yoy, while gross stage-2 declined 10 bps qoq and 73 bps yoy to 1.2%. Excluding motor finance, gross stage-3 improved to 1.3% from 1.4% in 1QFY27, although motor-finance gross stage-3 increased to 8.7% from 7.9%. |
