India Inc.'s financial performance in Q3-FY24 mirrored the trend seen in the last few quarters
Aditi Gupta
Economist
Bank of Baroda
FinTech BizNews Service
Mumbai, February 22, 2024: India Inc.’s financial performance in Q3-FY24 mirrored the trend seen in the last few quarters.
Corporate performance: Q3-FY24
Profit growth remains robust, compensating for the lower growth in revenues. Debt servicing too has improved despite higher interest costs. Our in-house corporate financial performance index (BoB-CFPI) is also showing a significant improvement in India Inc. performance. Nonetheless, the performance has not been equal across sectors. Pockets of stress remain with rural demand remaining a major pressure point. However, management commentary of various companies suggests that there are some signs of recovery amidst a moderation in inflation and adequate Rabi sowing. It will be interesting to see if the growth momentum can sustain. On the banking side, some pressure is visible amidst tight liquidity and a sustained increase in credit demand. We believe that India Inc. is likely to end FY24 on a similar note. However, risks remain from escalation in tensions in the Red-Sea region and resulting disruptions in supply chains. BoB Corporate Financial Performance Index (BoB-CFPI): To track corporate performance more closely and on a regular basis, we have constructed the BoB Corporate Financial Performance Index (BoB-CFPI). The quarterly index aims to capture corporate performance at a more comprehensive level by analyzing key parameters covering revenue, cost, profitability and debt servicing. The index aims to track the performance of corporates based on the published quarterly financial results. The data has been sourced from Ace Equity corporate database. A sample of 32 key sectors are tracked which range from automobiles, capital goods, chemicals, construction materials, consumer durables, hospitality, healthcare, iron and steel, IT, telecom, retailing, etc. We have excluded sectors such as banks, insurance etc. as they tend to add a substantial modicum of bias to the numbers and present a skewed picture. Equal weights have been assigned to all the sectors to maintain comparability. Hence, the size of the industry will not skew the picture as overall corporate performance should ideally be broad based. The current dataset includes a sample of 2,268 companies. It must be noted that the index has been constructed for the post-pandemic period i.e Jun’21 onwards to address partly the problem of base effect inflating the numbers. The sample companies used for FY23 (4 quarters) will be different from that in Q3-FY24.
BoB-CFPI in Q3FY24
BoB-CFPI shows a significant pickup in Q3FY24. The index improved to 128.8 in Q3-FY24 from 124.5 in Q3-FY23 118.8, registering a jump of 8.4%. Improved corporate profitability on the back of a correction in commodity prices has been a key driver behind this. With input prices abating, profit margins have seen a sharp uptick which has been contributing to higher profits even as sales have been much more muted. On a QoQ basis, while the index increased by 10.6% in Q2-FY24, it has risen by only 3.6% in Q3-FY24, suggesting some slowdown in momentum.
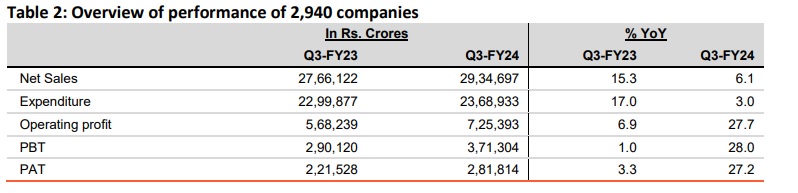
Financial performance of India Inc. in Q3-FY24 was very much similar to the trend seen in the last quarter. While profit growth has been robust, sales growth continues to lag behind. We have analyzed a sample of 2,940 companies which have announced results so far. It can be seen that sales growth increased by 6.1% in Q3 on a YoY basis, decelerating from a growth of 15.3% in the same period last year. However, on a sequential basis there is some pickup in sales growth. Profit growth has been robust, with all broad indicators of profit growth exhibiting double-digit growth. This can be explained by the sharp moderation in expenditure growth from 17% in Q2-FY23 to 3% in Q3-FY24.
To get a much clearer picture of the financial performance, we exclude the BFSI sector comprising banks, finance and insurance companies. For the non-BFSI sector, growth in net sales has been much more muted at just 2.7%. On the other hand, profit growth has continued at a smart pace driven by lower costs. Growth in expenditure has moderated significantly to just 0.7% from 17.3% in the same period last year. Interest costs too have remained largely steady, growing by only 0.7%. As a result, interest coverage ratio (ICR) of the companies has shown a marked improvement. The ICR is an indicator of the debt servicing capability of a firm and is calculated by dividing the profit before interest and tax (PBIT) to the interest cost. Thus this ratio shows whether the company is making enough profits to make interest payments. An increase in the ratio indicates improvement and viceversa. For the given sample of companies, the ICR has increased to 5.54 in Q3-FY24 from 4.37 in Q2- FY23. This is quite positive as it indicates that muted sales and high interest costs have not dented the debt service capability of the companies on an aggregate basis. However, there is a lot of divergence between sectors which might indicate the presence of some pockets of concern.
As pointed earlier, the interest coverage ratio for ex. BFSI companies has seen a marked improvement in the Dec’23 quarter. This is notwithstanding the fact that banks have increased the weighted average lending rates (WALR) on both outstanding and fresh rupee loans in the said period, and hence the interest costs of companies has also gone up. To put this in perspective, the WALR on fresh rupee and outstanding rupee loans has increased by 60bps and 40bps respectively in Q3-FY24 as compared with the same period last year, leading to a 1.5% increase in interest costs. However, WALR in Q3-FY23 had increased by much more (53bps for outstanding and 94bps for fresh rupee loans), which contributed to a 28.4% increase in interest costs. Hence, a part of the improvement in ICR can be attributed to a relatively lower increase in interest rates in Q3-FY24. However, a sharp increase in profits is perhaps the most distinguishing factor which explains the improvement in ICR, which has more than offset the higher interest costs. This is important because it helps to negate the belief that higher repo rate would put pressure on companies increasing the interest burden.
· Only telecom sector had an ICR of below 2. It must be mentioned here that the profitability in this sector continues to be marred by certain idiosyncratic factors such as AGR dues and payments pertaining to the spectrum auction. On top of this, due to the high capital expenditure required in the sector, it is also amongst the most heavily indebted sector and hence has a higher interest burden. Both of these factors can explain the low ICR in the sector. On the positive side, some green shoots are visible as the aggregate losses are narrowing which is also being reflected in an improvement in ICR in the latest quarter. · Apart from telecom, the 10 largest indebted sectors (as of 2022) are power, crude oil, infrastructure, iron and steel, realty, automobiles, chemicals, logistics and textiles. o Out of these, 7 noted an improvement in ICR over Q3-FY23, with auto, textiles and iron and steel sector witnessing the maximum improvement. o On the other hand, there was sharp fall in ICR of chemicals sector, led entirely by a sharp decline in profit in the sector, even as interest payments were lower. · Overall, a total of 20 sectors out of the 33 sectors witnessed an improvement in ICR in Q2- FY24 vis-à-vis Q2-FY23. The RBI is widely expected to keep interest rates on hold at least to Jun’24, which means that interest costs for companies are likely to remain stable for at least the next 2-quarters. Hence, the ICR of companies will be determined to a large extent by the profitability. While WPI inflation is likely to remain benign even in Q4-FY24, concerns remain from elevated shipping costs due to escalation in tensions in the Red-Sea region which can lead to higher expenditure and hence have a detrimental impact on profitability.
Disclaimer The views expressed in this research note are personal views of the author(s) and do not necessarily reflect the views of Bank of Baroda. Nothing contained in this publication shall constitute or be deemed to constitute an offer to sell/ purchase or as an invitation or solicitation to do so for any securities of any entity. Bank of Baroda and/ or its Affiliates and its subsidiaries make no representation as to the accuracy; completeness or reliability of any information contained herein or otherwise provided and hereby disclaim any liability with regard to the same. Bank of Baroda Group or its officers, employees, personnel, directors may be associated in a commercial or personal capacity or may have a commercial interest including as proprietary traders in or with the securities and/ or companies or issues or matters as contained in this publication and such commercial capacity or interest whether or not differing with or conflicting with this publication, shall not make or render Bank of Baroda Group liable in any manner whatsoever & Bank of Baroda Group or any of its officers, employees, personnel, directors shall not be liable for any loss, damage, liability whatsoever for any direct or indirect loss arising from the use or access of any information that may be displayed in this publication from time to time.