Census on Foreign Liabilities and Assets of Indian Direct Investment Entities for 2025-26
FinTech BizNews Service
Mumbai, 08 November, 2026: The Reserve Bank has released the provisional results of the 2025-261 round of the annual census on foreign liabilities and assets (FLA) covering cross-border liabilities and assets of the Indian entities [viz., companies, limited liability partnerships (LLPs), alternative investment funds (AIFs) and partnership firms] with inward/outward direct investment. The FLA census captures detailed information on foreign liabilities and assets in terms of direct investment, portfolio investment and other investments comprising of trade credit, loans, currency & deposits and other payables and receivables accounts, activity sector, sales, purchase, exports, and imports. The variations in outstanding foreign assets / liabilities between the beginning and end of a financial year would be different from flows recorded in India’s balance of payments (BoP) statistics during the year, as the former would also include valuation changes due to price and exchange rate movements.
Key highlights:
Of the total number of Indian entities reporting foreign direct investment (FDI) and/or overseas direct investment (ODI), around 97 per cent entities were unlisted as at end-March 2026, and also held a major share in total FDI equity capital (at face value) in India (Tables 1 and 2A).
Non-financial companies accounted for more than 90 per cent of the FDI equity at face value (Table 2B).
In terms of market value, listed and unlisted companies had almost equal share in total FDI equity capital as at end-March 2026, however, 96.6 per cent of the FDI debt is held by unlisted companies.
In rupee terms, the ratio of inward FDI to ODI moderated to 4.2 times as on end-March 2026 from 5.5 times a year ago.
Other investment liabilities [viz., trade credit, loans, currency and deposits, and other payables with unrelated (third party) non-resident entities] recorded a growth of 11.9 per cent (y-o-y) in rupee terms as on end-March 2026; other investment assets with unrelated non-residents also rose by 16.1 per cent during the same period.
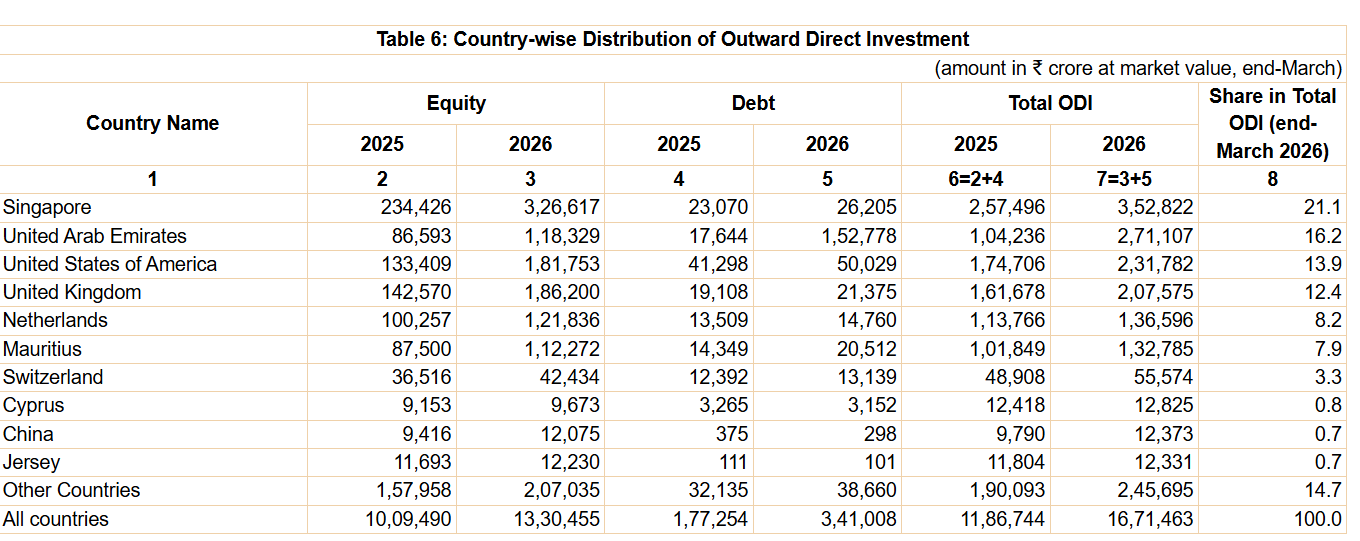
The United States of America (16.5 per cent) followed by Mauritius (14.5 per cent), Singapore (13.7 per cent) and the United Kingdom (10.8 per cent) were the top sources of outstanding FDI. In case of ODI, Singapore, the United Arab Emirates and the United States of America were the top destinations together accounting for more than 50 per cent share.
Manufacturing sector accounted for the highest share in the total outstanding FDI equity capital at market value (50.1 per cent), while 45 per cent share was held by services sector.
