India Inc. Ownership Tracker
Nse listed universe
Prerna Singhvi, CFA
Vice President – Economic Policy and Research
National Stock Exchange of India Limited
Mumbai, December 16, 2023: In this edition of our quarterly report “India Inc. Ownership Tracker”, we extend the analysis of ownership trends and patterns in NSE-listed companies to include data available for the quarter ending September 2023. We note the following key takeaways from our analysis.
• Promoter share increased for the second consecutive quarter:
Total promoter ownership in the NSE-listed companies and Nifty 500 Index increased for the second quarter in a row by 30bps and 35bps QoQ to 50.4% and 49.8% respectively, while their share in the Nifty 50 remained unchanged at 41.8%. The increase was primarily led by a sharp rise in Government share, partly offset by a drop in private promoter share—Indian as well as foreign.
• Outperformance of PSU companies drove Government share higher in the September quarter:
Government ownership—promoter as well as non-promoter—in the listed companies, Nifty 500 and Nifty 50 increased sharply by 98bps, 111bps and 55bps QoQ to a 21- quarter high of 9.4%, 9.8% and 14-quarter high of 6.0% respectively. This was partly attributed to strong relative outperformance of PSUs in the quarter gone by. For instance, the NIFTY PSE Index and the NIFTY PSU Bank Index generated gains of 17.9% and 27.9% respectively in the September quarter, compared to 2.3% for the NIFTY 50 Index.
• FII ownership declined for the second quarter in a row:
FII ownership in the NSE-listed universe, Nifty 500 and Nifty 50 companies fell by 61bps, 50bps and 48bps QoQ to 18.4%, 19.5% and 25.2% respectively in the September quarter. This was primarily led by a drop in FII share in some FII-heavy large-cap companies, notably Reliance Industries, Adani Enterprises, and Kotak Mahindra Bank—all of which are part of the Nifty 50 Index. In fact, FII share in the listed universe excluding Nifty 50 companies actually inched up by 12bps QoQ to a six-quarter high of 12.0%.
FIIs maintained their outsized but sequentially tapered OW bet on Financials, turned incrementally less bearish on India’s consumption story with a sequentially higher exposure to Consumer Discretionary and Consumer Staples, retained negative view on the investment theme with an UW position on Industrials, and maintained a neutral stance on other sectors viz., Information Technology, Communication Services, Healthcare, Utilities, Energy and Real Estate.
• DMFs share rose to fresh all-time high level:
DMF share in the NSE listed companies, Nifty 500 and Nifty 50 rose by 12bps, 21bps and 35bps QoQ to fresh record high of 8.75%, 9.1% and 10.1% respectively in the September quarter. While the actively managed funds held 7.1% in the NSE listed companies, the balance 1.7% was held by passively managed funds4. This has been led by strong net investments by DMFs during this period, aided by ever-increasing fund mobilisation through the SIP route. DMFs reduced their exposure to Financials for the third quarter in a row, remaining OW on the sector in the Nifty 50 Index and neutral in the Nifty 500 Index, and turned neutral on Industrials for the first time since 2005. Among other sectors, DMFs retained their negative stance on Consumer Staples and Energy, albeit incrementally less so, remained OW on Consumer Discretionary and Healthcare and neutral on Communication Services, Information Technology, Materials, Real Estate and Utilities.
• Individual investors’ share reached 16-year high:
Individual investors’ holding in the NSE listed universe rose by 31bps QoQ to a 16-year high of 9.7% in the September quarter, while that in the Nifty 50 and Nifty 500 Indices inched up by 6bps and 13bps QoQ to 8.3% and 8.8% respectively. This corresponds with renewed buying by individuals in the NSE’s cash segment during this period (Rs216bn).
• Institutional ownership concentration:
The share of Nifty 50 companies in total institutional investments fell for the second quarter in a row by a steep 3pp QoQ to near 16-year low of 64.6% in the September quarter—a result of continued outperformance of mid- and smaller companies vis-à-vis their large-cap counterparts. We also compare the depth of institutional ownership with its width in the market. FIIs meaningfully expanded their invested pool of companies between 2020 and 2022 (1200 in Dec’20 to 1450+ by Dec’21 and 1770+ by Dec’22, only to drop and rise back again this year), but with incrementally higher number of companies with a 5%+ share. In line with FIIs, DMFs also widened their investment pool by 100 odd companies in the September quarter to 1200, even as the number of companies where DMFs hold more than 5% rose by a mere one-fourth of the incremental investment pool. That said, the count of such companies has doubled in last eight+ years, thanks to fresh capital infusion into them, partly funded through rising SIP inflows.
Listed universe ownership trends
Ownership pattern of the NSE-listed universe (September 2023)
Promoter share in NSE listed companies inched up for the second consecutive quarter:
Total promoter ownership in the NSE listed universe rose by 30bps QoQ to 50.4% in the September quarter, marking the second increase in a row. This was driven by a significant increase in Government promoter holding by 96bps QoQ to 8.9%, the highest in 21 quarters, partly attributed to a meaningful outperformance of PSUs (Public Sector Undertakings) vis-à-vis the overall market. This more than made up for a drop in private Indian as well as foreign promoter ownership. While the private Indian promoter share fell by 35bps QoQ to a 15-quarter low of 33.1%, foreign promoter share declined for the fourth quarter in a row by 31bps to a nine-year low of 8.3%. In terms of number of companies, around 91% of the NSE listed companies (Where shareholding data is available for the quarter gone by and the same period last year) saw a drop in private Indian promoter stake in the September quarter.
Government ownership increased significantly in the September quarter:
Government ownership (promoter as well as non-promoter) in the NSE-listed space has been coming off since 2010, in-line with its efforts to garner higher revenues through the disinvestment route, barring a steep rise last fiscal year, thanks to the LIC issue. The September quarter saw a significant rise in Government ownership by 98bps QoQ to a 21- quarter high of 9.4%, on the back of significant outperformance of PSUs last quarter. For instance, the NIFTY PSE Index and the NIFTY PSU Bank Index generated returns of 17.9% and 27.9% respectively in the September quarter, compared to 2.3% in the NIFTY 50 Index.
FII ownership declined for the second quarter in a row:
Notwithstanding strong foreign capital inflows during the quarter, FII ownership fell by 61bps QoQ to 18.4%, marking the second sequential drop in a row. This was primarily led by drop in FII holding in some large-cap companies, notably Reliance Industries, Adani Enterprises, and Kotak Mahindra Bank—all of which are part of the Nifty 50 Index. Excluding these three companies, the drop in FII share was much lower at about 49bps QoQ. In fact, excluding the Nifty 50 companies, FII share actually inched up by a modest 12bps QoQ to a fivequarter high of 12% in the September quarter. The decline was seen across all sectors barring Consumer Discretionary and Information Technology, led by Financials and Energy, partly attributed to relative underperformance of these sectors compared to the broader markets. …
While DMF share reached record highs:
After a modest drop in the June quarter for the first time in nine quarters, DMFs’ share in the NSE listed companies rose by 12bps to a record-high of 8.8% in the September quarter. This corroborates with increased buying by DMFs in the quarter gone by, as evidenced by net inflows of Rs 540bn in the September quarter as compared to Rs 35.8bn in the previous quarter. A large part of this is attributed to strong inflows via the SIP route. SIP inflows continued to rise, reaching a record-high monthly run rate of Rs 160bn in September 2023, rising further to Rs 169bn and 171bn in October and November 2023, respectively. Average SIP inflows in the first eight months of FY24 (Apr-Nov’23) stood at Rs 155bn, nearly 20%/50% higher than the average monthly inflows of Rs 130bn/Rs 104bn in FY23/FY22. Out of the total DMF share of 8.8% in the NSE listed companies, passive funds held about 1.7%, with the balance 7.1% held by active funds, both of which are hovering near record-high levels.
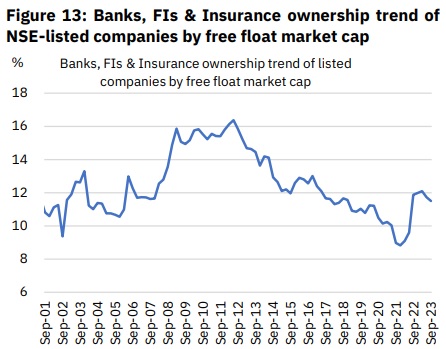
The share of Banks, Financial Institutions and Insurance companies in the NSE-listed space moderated for the second quarter in a row by 15bps QoQ to 5.7% after rising steadily for five quarters up to Mar’23.
Individual investors’ holding rose to over 16-year highs:
After remaining on sidelines over the previous four quarters, individual investors’ share in the NSE listed universe increased by 31bps QoQ to 9.7%, the highest level since Jun’07. While individual investors had turned net sellers in the June quarter with net outflows of Rs 211bn, Q2FY24 saw a reversal with net inflows (Difference between total buy value and total sell value of individual investors) of Rs 216bn. This increased participation of individual investors is also visible in their improved market activity—measured in terms of number of investors trading in a month and new investor registrations. The momentum continued in October as well, with net inflows by individual investors during the month coming in at strong Rs 141bn.
Institutional ownership in NSE floating stock fell for the second consecutive quarter:
DMF ownership in NSE floating stock increased by 35bps QoQ to an all-time high level of 17.6% in the September quarter—primarily led by an increase in ownership of active mutual funds. This, however, was more than offset by a decline in the share of all other institutional categories. FII ownership dropped sharply by 99bps QoQ to 37.1%, the lowest in 14 years. FII share in the NSE floating stock is now 8.6pp below the peak share seen eight years back (March 2014). Excluding Nifty 50, however, FII share in the floating stock remained steady on a QoQ basis at 28.9%. Banks, Financial Institutions and Insurance companies’ share in the NSE free-float fell for the second consecutive quarter to 11.5% (-23bps QoQ). As such, the overall institutional share in the NSE listed floating stock moderated by 109bps QoQ to 70.9%, 1.4pp below the Mar’23 high of 72.3%. Individual investors’ share in the NSE free-float market cap witnessed the largest sequential jump in two years, with a 74bps QoQ increase to 19.5% in the September quarter. That said, the share still stands nearly 9.5% below the peak individual ownership level seen over the last 20 years.
Long-term ownership trend of the NSE-listed universe
Long-term trend shows a steady drop in promoter ownership during 2009-2019, followed by a marginal increase thereafter:
The long-term trend indicates a sharp rise in promoter ownership between 2001 and 2009 (To 19-year high of 57.6% in March 2009) that gradually tapered off since, coinciding with the SEBI’s decision to increase the minimum required free float from 10% to 25% in 2010. However, the drop has been primarily led by a sharp decline in Government ownership over the years, and strategically so, with the aim of expanding public partnership in the ownership of CPSEs (Central Public Sector Enterprises) and augmenting its resources for higher expenditure towards economic development. On the other hand, overall private promoter ownership—Indian and foreign promoters combined—has increased by 11.6pp between June 2010 to December 2021. Promoter share, however, has been inching up since last few years barring FY23, primarily led by an increase in Government share.
Sharp rise in DMF ownership during 2014-19 supported by rising SIP inflows:
Barring a drop in FY21, DMF ownership has seen a sharp increase over the previous six fiscal years (FY15-FY23), largely reflecting the sustained retail interest in equity mutual funds as an investment channel through SIPs. Drop in DMF ownership in FY21 (Apr-Mar’21) had been largely on the back of moderation in SIP inflows as well as high redemption pressures, thanks to macroeconomic slowdown and attendant drop in disposable incomes that got accentuated by the COVID-19 outbreak. This partly found its way to Indian equities via higher direct retail investments, as visible from a steady increase in direct retail ownership during this period. With indirect participation by individual investors seeing a renewed jump beginning June 2021 via the SIP route, share of DMFs in the NSE listed universe has risen steadily to record-high levels. Banks, FIs & Insurance share, on the other hand, has been gradually dropping off since 2012, only to see a significant jump in FY23 (+158bps).
FII ownership dropped to sub 20% in FY23 after almost a decade:
FII ownership in the NSE-listed space saw a gradual increase between 2002 and 2015, except for a brief period around the 2007-08 financial crisis, but dropped marginally over the subsequent three years, reflecting negative global cues including the US-China trade war and Brexit concerns. FII share picked up over the next two years until December 2019 but fell sharply during the first two quarters of 2020 post the onset of the COVID-19 pandemic. This, however, was temporary as huge liquidity injection globally improved risk appetite, leading to a jump in FII share in the second half. Since then, FII share has been trending down, reflecting weakened investor sentiments in the wake of recurring COVID waves, China slowdown, Russia-Ukraine war, worsening growth-inflation dynamics, and rapid monetary tightening by global central banks, notably the US Fed.
Direct individual holding has remained between 8 to 10% for more than a decade now:
Not surprisingly, while individual investments through the SIP route has been rising over last few years, barring a steady drop in FY21, direct individual participation in equity markets remained quite stable—a sign of maturing markets and indirect ownership. Individual investors’ ownership of the NSE listed universe declined steadily between 2001 and 2012 but has since increased only marginally.
SIP inflows on a rising trend:
SIPs have been a preferred route for individual investors to invest in equity markets barring FY20-21. After a drop in 2020, that saw individual investors shift away from being indirect investors to direct participants in the equity market, inflows into mutual funds through the SIP route has been rising steadily since then, barring some moderation in early FY22 due to the virulent second wave of the pandemic. Monthly SIP inflows in FY23 (Apr’22-Mar’23) averaged at Rs130bn vs. Rs104bn in FY22, rising further to Rs155bn during the eight months of the current fiscal (Apr’23-Nov’23). A sharp increase in SIP inflows in the September quarter led to mutual fund ownership rising to a record high level.
Passive DMFs’ ownership at near record high level:
Passive holding of DMFs through ETFs and index funds in the NSE listed companies has risen rapidly over the past few years. The AUM of passive of unmanaged mutual funds has increased at a CAGR of 42% over the last five years, as compared to 22% CAGR of the AUM of active or managed funds. Annualised growth in the AUM of passive funds since 2015 at 65% is much higher than 23% for actively managed funds, partly attributed to a low base. This has led to the share of passive funds’ holding in the overall holding of DMFs in NSE listed companies rising from a mere 2% in 2015 to slightly shy of 20% (Rs 5.3trn as of September 30th, 2023). The quarter gone by, however, saw some moderation in passive funds’ holding, with the AUM rising by 5.5% QoQ as compared to a 10.6% QoQ growth in the holding of active funds in NSE listed companies. Out of the 8.7% share of DMFs in the NSE listed universe, 1.7% is currently held by passive funds, while 7.1% is in the form of active funds. In the floating stock, out of the 17.6% share of all mutual funds in the quarter ending September 2023, passive funds held 3.4%, with the balance 14.2% held by active funds.
FIIs remained net buyers in the September quarter, albeit with a lower quantum:
After significant volatility in FII flows in FY23, Q1FY24 had seen FIIs becoming strong buyers, with a 10-quarter high net inflow of US$12.5bn. FIIs remained buyers in the September quarter as well, even as the net inflows significantly moderated to US$5.4bn on the back of the global uncertainty and hardening US 10-year yields. This was in line with the trend seen across other emerging markets. Notwithstanding net buying, FII ownership dropped in the September quarter, thanks to a decline in FII share in some large-cap companies. FIIs, however, turned net sellers in October, only to resume buying in November, with net inflows of US$ 1.9bn in the quarter thus far (As on December 12th, 2023)
Direct participation by individual investors rising after a muted start to year:
Individual investors’ participation in Indian equities picked up meaningfully during 2020 and 2021. A sharp market crash in March 2020 after the onset of COVID-19 pandemic lured individual investors into trading in equity markets, with a strong market rebound thereafter further strengthening their sentiments. Individual investors turned net buyers of Indian equities in 2020 after a 11-year long hiatus between 2009-19, further strengthening their participation in the subsequent two-and-a-half years. Between Jan 2020 and December 2022, they invested a total of Rs2.79trn in NSE’s capital market segment (secondary market only). Strong individual participation over the last few years is also visible in new investor registrations. The last three years ending September 2023 saw an addition of 83.1m new Demat accounts by NSDL and CDSL combined. This is about 64% of outstanding accounts with both the depositories as of September 2023.
Direct individual participation moderated in the last quarter of 2022 and remained on sidelines in the first two quarters of 2023 as well. The September quarter, however, saw a reversal, with individuals turning net buyers once again with net inflows of Rs 216bn during the quarter—the highest in five quarters. This, in turn, resulted in an increase in individual holding in the quarter gone by. The buying sentiment continued in the month of October, with Rs 141bn invested by individual investors in the month.
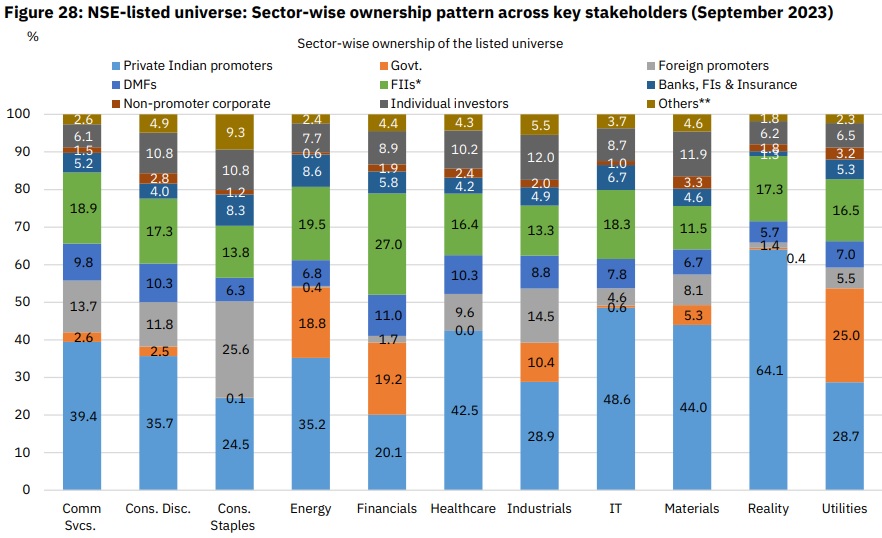
Sector-wise ownership of the NSE-listed universe (September 2023):
The sector-wise ownership pattern of the NSE-listed universe across key stakeholders in the quarter gone (Jul’23-Sep’23) shows that the Real Estate sector continues to lead in terms of promoter ownership at 65.9% (-48bps QoQ), followed by Utilities at 58.2% (+18bps QoQ), Materials at 56.2% (+17bps QoQ), Communication Services at 53.8% (-27bps QoQ), Information Technology at 53.6% (-20bps QoQ) and Industrials at 53.6% (-21bps QoQ). The increase in overall promoter share during this period was led by Financials, which saw a 93bps QoQ increase to 40.9%, followed by Energy (+57bps QoQ to 15-quarter high of 52.0%) and Consumer Staples (+29bps QoQ to 50.2%). Sector-wise, Utilities retained the top spot in terms of Government ownership for the third quarter in a row, with a 33bps QoQ increase to a 12-quarter high of 25.0%. Financials stood second, registering a significant 208bps QoQ jump in ownership to a nine-year high of 19.2%, partly attributed to outperformance of PSU banks compared to the financial sector at large (27.9% return for NIFTY PSU Banks vs 0% for NIFTY Financial Services for the September quarter). Government holding in the Energy sector increased by 274bps QoQ to a 15-quarter high of 18.8%, primarily led by steep rally in some of the Government owned companies including ONGC and Coal India. The diversity in DMFs’ share across sectors was fairly low, with Financials leading at 11.0% (-17bps QoQ), followed by Healthcare at 10.3% (+28bps QoQ), Consumer Discretionary at 10.3% (+25bps QoQ) and Communication Services at 9.8% (+34bps QoQ). Barring Financials and Industrials, all sectors saw an increase in the share of holdings by DMFs. In terms of FII share, Financials sector leads with a 27.0% share, even as there has seen a meaningful drop in the September quarter (-159bps QoQ) as well as over the last three years (-9.0pp since December 2020). This is followed by Energy and Communication Services at 19.5% (-89bps QoQ) and 18.9% (-27bps QoQ) respectively. Materials had the lowest FII share in the September quarter at 11.5%. All sectors apart from Consumer Discretionary and Information Technology witnessed a decline in FII ownership in the September quarter.
Sector allocation in the NSE-listed universe for key stakeholders (September 2023):
The table below shows sector allocation for key shareholder categories in all NSE-listed companies as of September 2023. Government ownership remains concentrated in Financials, Energy, Utilities, and Industrials, together accounting for almost 90% of the Government’s allocation in the NSE listed space. Consumer sector—Discretionary and Staples—account for 42.4% (-137bps QoQ) of the exposure of foreign promoters to the NSE-listed space, followed by Industrials at 19.9% (+20bps QoQ). Except for an outsized exposure to Financials, DMF portfolio remains more diversified as compared to FIIs. Both FIIs and DMFs saw their portfolio allocation to Financials significantly drop by over 1pp QoQ on the back of the relative underperformance of the sector compared to the rest of the listed space. The drop for DMFs was absorbed by Consumer Discretionary, Health Care, Industrials and Utilities. For FIIs, the decline in Financials allocation was compensated for by a 54bps QoQ increase in portfolio allocation to Consumer Discretionary to 9.7%, followed by a 53bps QoQ increase in allocation to Industrials to a 12-year high of 8.3%. This indicates incrementally bullish view of FIIs on India’s consumption as well as investment story.
Economic Policy & Research
Tirthankar Patnaik, PhD; Prerna Singhvi, CFA; Ashiana Salian; Prosenjit Pal ;Smriti Mehra; Anshul Tayal; Anand Prajapati; Shuvam Das; Isha Sinha
(Disclaimer: This report is under no circumstances intended to be used or considered as financial or investment advice, a recommendation or an offer to sell, or a solicitation of any offer to buy any securities or other form of financial asset. The Report has been prepared on best effort basis, relying upon information obtained from various sources, but we do not guarantee the completeness, accuracy, timeliness or projections of future conditions provided herein from the use of the said information. In no event, NSE, or any of its officers, directors, employees, affiliates or other agents are responsible for any loss or damage arising out of this report. All investments are subject to risk, which should be considered prior to making any investment decisions. Consult your personal investment advisers before making an investment decision.)