Average gross public debt for advanced economies (AEs) increased from 66.7% in 2001-10 to 95% in the last decade and is expected to rise to 108.8% in the ongoing decade (2021-28)

Tirthankar Patnaik, PhD
Chief Economist
National Stock Exchange of India Limited (NSE)
Mumbai, January 31, 2024: This is the second part of the series on the January 2024 edition of the ‘Market Pulse’, published by NSE. The first part was published on this website on January 30, 2024. In the monthly publication issued by the Economic Policy and Research (EPR) department of the National Stock Exchange of India, titled Market Pulse, a review of major developments in the economy and financial markets for the month gone by, is undertaken.
Global debt has reached record level
Human history of debt dates long back, much earlier than history of money. David Graeber’s book published in 2011 (Debt: The First 5000 Years) draws the first known record of debt back in 3500BCE. As per the Institute of International Finance, Global debt has reached record level of US$ 307trn (349% of global GDP) in 2023. Of this, sovereign debt forms 102% of the global GDP. Public debt around the world has been rising over the last two decades. Cascading crises (Global Financial Crisis, Covid-19 pandemic) have triggered a sharp acceleration to this trend. Global public debt has increased more than fourfold since the year 2000, clearly outpacing global GDP, which tripled over the same time. This increase in debt is largely driven by the advanced economies (AEs). The average gross public debt for AEs increased from 66.7% in 2001-10 to 95% in the last decade and is expected to rise to 108.8% in the ongoing decade (2021-28). Digging deeper into IMF’s data for the last century, we note that global indebtedness rose to 100-year high levels after the pandemic. While there has been some consolidation in the debt levels since then, the problem remains bigger than what is being perceived, as the deficit in AEs is expected to remain elevated over the next five years (US fiscal deficit likely to reach 7.8% by 2028). With many countries facing general elections in 2024, the issue might accentuate, adding further pressure to the already high debt levels. This, in turn, may have implications for global cost of capital. As for the Emerging Markets (EMs) like India, the debt levels are relatively lower than their developed counterparts, but higher interest rates and external exposure pose serviceability issues for some economies such as Sri Lanka and Pakistan. Even as India faces relatively lower risk with longer debt maturity profile and low exposure to external debt, a roadmap to gradual fiscal consolidation is crucial to bring down debt levels and improve quality of expenditure.
• Public debt at 100-year high levels across major economies: Economies across the world adopted expansionary fiscal policies to support growth during the pa ndemic years. Looking at the debt history of the last 100 years, the public debt (% of GDP) is expected to be highest for the ongoing decade (2021-28) for both the AEs (108.8%) and EMEs (64.9%). The debt levels for most AEs surpassed their GDPs in 2023 with US at 123.3%, UK at 104.1% and Japan at a staggering 255.2%. While debt levels of EMs are relatively lower, they remain at elevated levels for China (83%), Brazil (88.1%) and India (81.9%). High debt levels across the globe have been accompanied by a high level of fiscal deficit as well. The fiscal deficit of the General govt. in the US touched an all-time high of 14% in 2020 (surpassing the 13.2% level during the Global Financial Crisis). While there has been some consolidation, the fiscal deficit in the US is expected to remain at an average of about 7.1% over the coming five years, much higher than the long-term average. China also reported record level deficit of 9.7% in 2020. While it has come down to 7.1% in 2023, it is expected to further increase to 7.8% by 2028, thanks to aging population and piling of debt. Similarly, public debt for India went up from 75% prior to the pandemic to 88.5% of the GDP in 2020— the highest over the last 100 years. It has since declined to 86.5% in FY23 and is expected to further moderate to 80.5% by 2028. That said, it is expected to remain well above the 60% target as per the NK Singh’s Committee report.
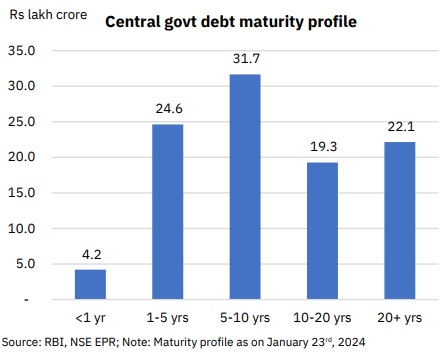
• Debt Serviceability—another hammer on the nail: While EMs have relatively lower levels of debt, the higher interest rates make debt servicing more difficult. India’s interest payments on public debt as a % of total expenditure stood at 18.1% in 2022, higher than its EM peers. This leaves little room to maneuver the expenditure as the percentage of committed expenditure increases. Further, within the AEs, the UK reported the highest reading of 9%, followed by the US at 7.9%. Even as Japan has the highest public debt-to-GDP at 261%, near zero interest rates has kept the interest costs manageable. While interest payments and debt are key to overall fiscal health, debt sustainability must be looked at in conjunction with the rate of GDP growth. Given India’s growth has remained above the effective interest rates (Figure 9) for most part of the last 40 years, the debt remains largely sustainable. In addition, longer maturity profile (41.4% of the debt having maturity of over 10 years) and much lower exposure to external debt (18.8% of GDP—one of the lowest among major EMs, 80% of which is long-term in nature) reduces risk further.
• Elections in (most) countries may pose a threat to their already high debt levels: The current year is going to be a big year for democracy as 46% of the world’s population (53.3% of our sample countries) will have general elections. As seen historically, general election years tend to see more populist measures by the Governments, thereby putting more pressure on the already elevated debt and deficit levels. Countries such as Sri Lanka and Pakistan have seen their high levels of debt turning unsustainable over the last couple of years. High debt and fiscal deficit levels may put pressure on yields despite easing inflation, which in turn may have implications for global cost of capital. Even as India faces relatively lower risk with longer debt maturity profile and low exposure to external debt, a roadmap to gradual fiscal consolidation is crucial to bring down debt levels and improve quality of expenditure.
Gross public debt (% GDP) of AEs over the last 10-years
General government debt across countries hiked as a result of the expansionary fiscal policies taken to combat the pandemic induced slowdown. However, the debt is expected to remain at elevated levels over the next five years for most large economies like US (increase from 123.3% in 2023 to 137.5% in 2028), UK (from 104.1% in 2023 to 108.2% in 2028) among others. Canada, Japan and Germany will some debt consolidation over the coming years.
Gross public debt (% GDP) of EMs over the last 10 years
Among the emerging markets, as per the IMF’s WEO, Brazil, South Africa, Mexico are expected to accumulate higher levels of debt in the coming years. China is likely to have debt to GDP ratio at over 104% in 2028, up from 83% currently. India on the other hand, is expected to consolidate its debt levels from the current 82% to 80.5% in the next five years.
Decadal average of Gross public debt (% of GDP) across countries
The debt history of the last 100 years, the public debt (% of GDP) is expected to be highest for the ongoing decade (2021-28) for both the AEs (108.8%) and EMEs (64.9%). Japan’s average debt is expected to touch the ceiling in this decade, settling around 253% in 2028.
Comparing India’s interest paid on public debt (% Govt expenditure) with AEs
AEs usually tend to have lower interest payments as against their Emerging counterparts, owing to lower interest rates. However, the high interest rate regime has pushed up the interest payments of AEs with the interest paid on public debt (% of GDP) of UK rising to 9% in 2022—the level last recorded in late 1990s, and US at 7.9%.
Comparing India’s interest paid on public debt (% Govt expenditure) with EMs
Among the EMEs, India’s interest payment at US$165.5bn in 2022 or 18.1% of total expenditure that year stood second to Mexico while Russia had the lowest share of interest payments at 2.2% (US$ 16.2bn).
Debt levels are considerably higher for AEs relative to the EMs. India’s general govt. debt level at 83% is higher than China (77%) and South Africa (71%) but lower than Brazil (85.3%). At 18.1% of the total expenditure, interest payments remain a concern for India.
Comparison of India’s External debt (% GDP) with EMs Among EMs, South Africa, Mexico and Indonesia have high external debt (%GDP) in the range of 30-40%. The external debt of EMEs has declined from their 2021 levels, except South Africa that saw a surge, partly on account of contraction in its GDP growth (-3.5%YoY) in 2022.
Debt is sustainable if the effective interest rate paid is lower than the nominal GDP growth. Over the last 40 years, ERI exceeded GDP growth during early 2000s, which was followed by a steep rise in debt levels. The next jump was observed during the pandemic. India’s debt otherwise has remained sustainable.
Even as India’s debt remains high, its debt sustainability stands strong, thanks to longer maturity profile of the outstanding debt (41.4% of 10-year and above maturity), and relatively lower exposure to external debt, of which 80% is long-term. Further, more than 95% of the sovereign debt is rupee-denominated. In 2023, India’s external debt (% GDP) fell to 18.8% from 19.7% in the previous year.
Authors of Market Pulse January 2024: Tirthankar Patnaik, PhD; Prerna Singhvi, CFA; Ashiana Salian, Prosenjit Pal, Smriti Mehra, Ansh Tayal, Anand Prajapati, Shuvam Das.
(To be continued)
(This report is intended solely for information purposes. This report is under no circumstances intended to be used or considered as financial or investment advice, a recommendation or an offer to sell, or a solicitation of any offer to buy any securities or other form of financial asset. The Report has been prepared on best effort basis, relying upon information obtained from various sources. NSE does not guarantee the completeness, accuracy and/or timeliness of this report neither does NSE guarantee the accuracy or projections of future conditions from the use of this report or any information therein. In no event, NSE, or any of its officers, directors, employees, affiliates or other agents are responsible for any loss or damage arising out of this report. All investments are subject to risks, which should be considered prior to making any investments.)