The average ticket size of personal loans across population group is higher for Sep'23 than for Dec'18

Jahnavi Prabhakar,
Economist,
Bank of Baroda
Mumbai, February 12, 2024: The study aims at understanding the composition of the subsectors of personal loans and the changing trends. The two time periods chosen are December 2018 and September 2023 which were similar in terms of having similar repo rate regimes. The study also looks at composition of housing sector loans and the average ticket size across different credit limits. In the end, an analysis across population groups is presented. Personal loans segments by Interest Rate The subsectors of personal loans include housing, consumer durables, vehicles, personal credit card and other personal loans.
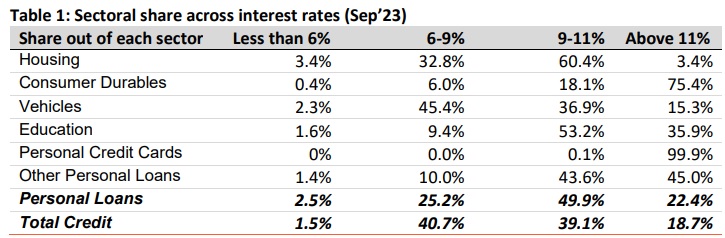
Of this, sectoral share in total outstanding personal loans as of September 2023 was as follows: housing sector (53.5%), ‘other personal loans’ (28.9%), vehicles (9.8%), credit cards (4.8%) and consumer durables (0.7%). Table 1 provides shares of different interest ranges for loans outstanding under each of these headings. The 4 buckets are less than 6%, 6-9%, 9-11% and above 11%. Of the total credit, most of the loans are concentrated in the 6-9% and 9-11% ranges. Over 50% of the personal loans are found in the 9-11% range at the aggregate level.
Table 1: Sectoral share across interest rates (Sep’23)
2 interest rate regimes
Next we see if sectoral share have changed in two interest rate regimes. Currently, RBI’s repo rate is at 6.5% and the repo rate was at similar level in Dec’18. Comparing the loans concertation across varying interest rates in Dec’18 with Sep’23, the picture remains the same for sectors such as consumer durables, credit cards and ‘other personal loans’. All 2 of them have majority share of the loans concentrated in the ‘above 11%’ bucket. However, other sectors have registered some changes in the last 5-years with:
Table 2: Sectoral share across interest rates (Dec’18)
Distribution of personal loans by Size of Credit limit
In terms of size of credit limits we look at amount outstanding in 6 buckets of credit limit ranging from less than Rs 25,000 to above Rs 1cr (Table 3 & 4) for the two points of time.
able 3: Sectoral share across Credit Limits (Sep23)
Table 4: Sectoral share across Credit Limits (Dec’18)
2018 Scenario
In 2018, 47.1% of the number of borrowers were in the Rs 10-50 lakh range of loans. This has increased to around 58% in 2023. Higher cost of dwellings as well as individuals moving to higher value flats can be the factors causing this movement. The share of Rs 2-10 lakhs of credit limit correspondingly came down during this period. The share of borrowers taking loans of above Rs 50 lakhs increased from 4.2% to 9.1% reflecting the same factors driving purchase of higher value dwellings.
Table 5: No. of accounts in housing sector across different credit limit Sep’23
Ticket Size of housing loans
Distribution of personal loans by Population Group
The availability and accessibility of banking service across population groups can be analyzed next. The entire portfolio is segregated across rural, Urban, semi-urban and metropolitan regions.
Other personal loans
Interestingly the ticket size of the ‘personal loans’ has come down across the board. Average ticket size of personal loan in Sep’23 is higher than the average ticket size in Dec’18. Interestingly, the ticket size of personal loan in metropolitan area is far lower than the ticket size in rural area for Sep’23. A conclusion that can be drawn is that loans of smaller ticket sizes are being provided by banks on the back of the higher demand for such loans.
Concluding Remarks
Across interest rates, housing loans have the highest concentration in the interest range of 6- 9% in Dec’23 compared with the interest range of 9-11% for Sep’23. This is also on account of the adoption of the ELBR that has resulted in automatic transmission of interest rates hikes for this segment.
On distribution of personal loans based on the size of credit limit, it has been noticed in the retail segment there has been a shift towards small ticket loans. There is also a preference of high value vehicle, which is why the vehicle loans are growing in the Rs 10-50 lakh bucket. Housing and education loans are concentrated in the Rs 10-50 lakh bucket led by rising cost of education and likelihood of students moving abroad for higher education.
Specifically on home loans, there are more borrowers in the Rs 10-50 lakh loan bucket in Sep’23 from Dec’18 mainly because of the rising cost and greater demand for high value flats. The average ticket size of home loan is above Rs 36 lakh for Sep’23. On distribution of personal loans by population groups, it has been observed that most of personal loans are concentrated in the metropolitan areas. The majority share of education loans are concentrated in the metropolitan and semi-urban area. Notably, the share of other personal loans is gradually inching up in metro and urban regions. Furthermore, the average ticket size of personal loans across population group is higher for Sep’23 than for Dec’18.
(Disclaimer: The views expressed in this research note are personal views of the author(s) and do not necessarily reflect the views of Bank of Baroda. Nothing contained in this publication shall constitute or be deemed to constitute an offer to sell/ purchase or as an invitation or solicitation to do so for any securities of any entity. Bank of Baroda and/ or its Affiliates and its subsidiaries make no representation as to the accuracy; completeness or reliability of any information contained herein or otherwise provided and hereby disclaim any liability with regard to the same. Bank of Baroda Group or its officers, employees, personnel, directors may be associated in a commercial or personal capacity or may have a commercial interest including as proprietary traders in or with the securities and/ or companies or issues or matters as contained in this publication and such commercial capacity or interest whether or not differing with or conflicting with this publication, shall not make or render Bank of Baroda Group liable in any manner whatsoever & Bank of Baroda Group or any of its officers, employees, personnel, directors shall not be liable for any loss, damage, liability whatsoever for any direct or indirect loss arising from the use or access of any information that may be displayed in this publication from time to time.”