The bank’s Profit After Tax of Rs 151.7 Cr, up 131.0% Year-on-year
FinTech BizNews Service
Mumbai, 02 November, 2026: Suryoday Small Finance Bank Limited has announced its unaudited financial results for the quarter and half year ended 30th September 2026.
Financial Highlights: Q2 FY27
Business Highlights: Q2 FY27
Business Highlights: H1 FY27
Financial Highlights: H1 FY27
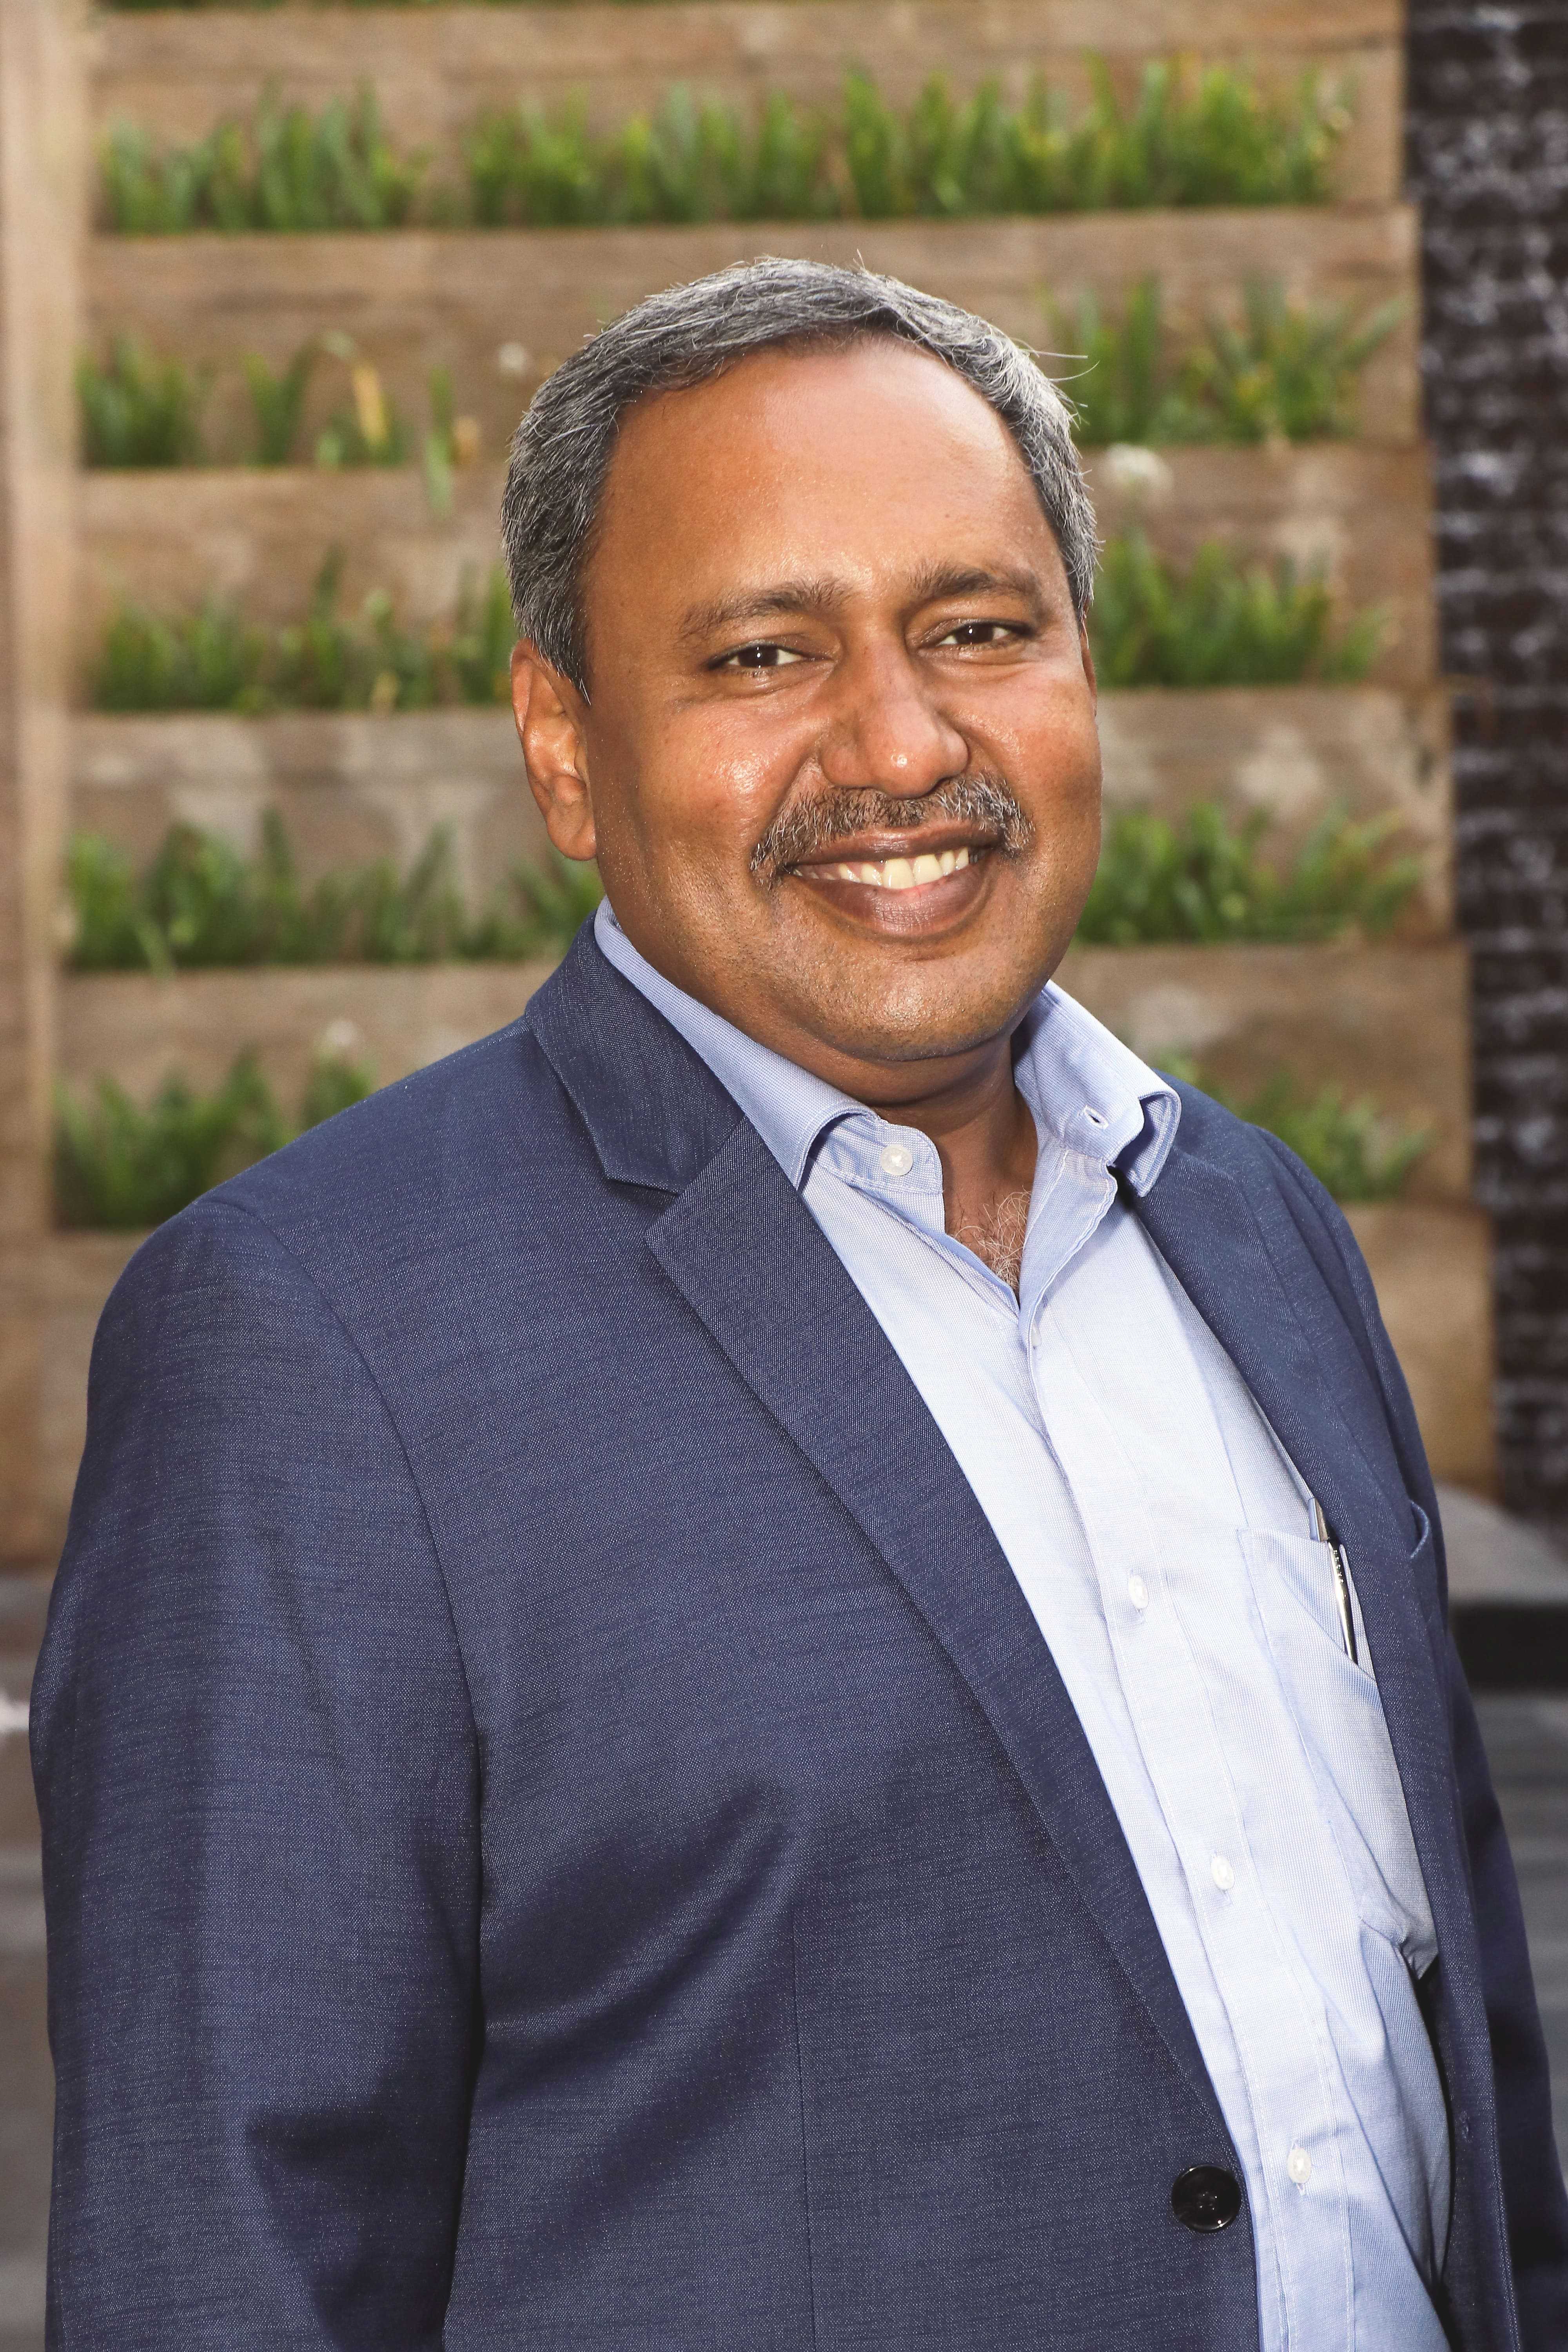
Commenting on the performance, Mr. Baskar Babu Ramachandran, MD & CEO, Suryoday Small Finance Bank, said: “During the second quarter, we continued to deliver healthy business growth, supported by sustained momentum in advances, disbursements and deposits. Gross Advances stood at Rs. 14,972 Cr as of September 2026, registering year-on-year growth of 34.6%, while disbursements during the quarter grew by 27.4% Year-on-year to Rs. 3,096 Cr. Total Deposits increased by 35.0% Year-on-year to Rs. 16,184 Cr, supported by continued growth in the Bank’s retail deposit franchise. CASA grew by 26.8% Year-on-year to Rs. 3,142 Cr, reflecting continued efforts to strengthen the Bank’s granular liability franchise.
We continue to focus on our Vikas Loan portfolio in the Inclusive Finance segment while expanding our secured lending businesses across Mortgages, Wheels and MSME. Going forward, the Bank shall prioritise disciplined growth, robust underwriting, strong collection efforts and enhancing operating efficiency.
The Bank intends to grow its digital Banking division not only as a means to acquire quality customers, but also to be a meaningful contributor to the franchise across deposits, assets and earnings. I am excited about our growth prospects in Digital Banking, and we shall continue to update on our progress with respect to this initiative.
We have witnessed a further improvement in asset quality during the quarter, with GNPA declining to 2.9% as of September 2026, compared with 6.5% in June 2026 and 5.9% in September 2025, after giving effect to the claims received from CGFMU. As of Sept’26, GNPA stood at Rs. 438 Cr, NNPA at Rs. 224 Cr of which Rs. 181 Cr is receivable under CGFMU scheme. The PCR (excluding technical write offs) stands at 48.8%.
The Bank reported a Profit After Tax of Rs. 76.5 Cr during the quarter and Rs. 151.7 Cr during the half year ended September 30, 2026, which is higher than the profits during the full year ended March 31, 2026.
The Bank shall maintain a prudent approach with a sharp focus on asset quality, credit costs and sustainable profitability, while building a more diversified and resilient institution and creating long-term value for all stakeholders.”
Key Metrics: Q2 & H1FY27
Particulars | Unit | Q2 FY27 | Q2 FY26 | Y-o-Y | Q1 FY27 | Q-o-Q | H1 FY27 | H1 FY26 | Y-o-Y |
Gross Advances* | Rs. Cr. | 14,972 | 11,124 | 34.6% | 14,376 | 4.2% | 14,972 | 11,124 | 34.6% |
Disbursement^ | Rs. Cr. | 3,096 | 2,430 | 27.4% | 2,954 | 4.8% | 6,050 | 4,691 | 29.0% |
Deposits | Rs. Cr. | 16,184 | 11,991 | 35.0% | 14,634 | 10.6% | 16,184 | 11,991 | 35.0% |
Retail Deposit to Total Deposit | % | 84.5% | 86.0% | -153 bps | 87.3% | -284 bps | 84.5% | 86.0% | -153 bps |
CASA Ratio | % | 19.4% | 20.7% | -125 bps | 21.0% | -158 bps | 19.4% | 20.7% | -125 bps |
Yield | % | 16.8% | 16.4% | 46 bps | 16.2% | 65 bps | 16.6% | 16.5% | 5 bps |
NIM | % | 7.2% | 6.9% | 28 bps | 7.2% | 2 bps | 7.2% | 7.1% | 10 bps |
Cost of Deposits | % | 7.3% | 7.7% | -36 bps | 7.4% | -5 bps | 7.4% | 7.8% | -43 bps |
Cost of Borrowings | % | 7.7% | 7.7% | 5 bps | 7.8% | -5 bps | 7.8% | 7.9% | -12 bps |
Cost of Funds | % | 7.4% | 7.7% | -29 bps | 7.5% | -6 bps | 7.4% | 7.8% | -37 bps |
Cost to income | % | 70.6% | 76.6% | -596 bps | 70.1% | 51 bps | 70.4% | 72.9% | -252 bps |
GNPA Ratio** | % | 2.9% | 5.9% | -296 bps | 6.5% | -355 bps | 2.9% | 5.9% | -296 bps |
NNPA Ratio** | % | 1.5% | 3.8% | -225 bps | 1.2% | 28 bps | 1.5% | 3.8% | -225 bps |
PCR (Excluding Technical Write offs) | % |
