LII has shown lower inflation compared with the ECI
Dipanwita Mazumdar
Economist,
Bank of Baroda
Mumbai, February 16, 2024: In the age of growing consumerism, rising aspirations of middle class and higher share of working age group population, lifestyle products (goods and services) have become progressively important. It is generally felt that inflation for these products may not really have a sharp impact on consumption as people who migrate to consuming more of these products could become less price sensitive. This is supported by the recent development of premium products selling well as a time when other basic products have uneven demand. The purpose here is to examine how inflation for lifestyle products has moved. For this purpose a carved out approach has been followed where certain items from disaggregated CPI data have been used and an index has been constructed for the same, connoted as the ‘lifestyle inflation index’ (LII). The items chosen are based on what we see as lifestyle products within the entire basket of commodities. We are however unable to distinguish certain sub-category of items where differences in prices are high. For example under the ‘mobile phones’ category of CPI, all price range of products are included. Thus while interpreting the index, one needs to keep this limitation in mind.
Components and weights
A total of 69 items has been chosen from a list of 300 disaggregated items of CPI for the construction of lifestyle inflation index. It has a weight of 18.8% in the overall CPI basket and ranges from lifestyle food products such as Millets, Jowar, Bajra to Chocolates, Biscuits, Dry fruits, major packaged meals and canned beverages, foreign liquor etc. Within the clothing and footwear criteria, it includes, Cloth for Coat, Trousers, Suit, Headwear, Belts, Ties, Leather Boots. Most of the items of LII fall in the miscellaneous category. It includes Cloth For Upholstery, Curtains, Tablecloth, Domestic Servant or Cook, Monthly Maintenance Charges, Motor Car, Jeep, Air Fare, electronic items such as PC or Laptop, Camera and Photographic Equipment and other miscellaneous items such as Hotel Lodging Charges, Club Fees etc, to name a few. The lifestyle inflation index has been constructed since 2014-15 onwards. Notably, it has a break of two periods i.e. 2019-20 and 2020-21 as data were not available for disaggregated CPI due to the pandemic related disruption.
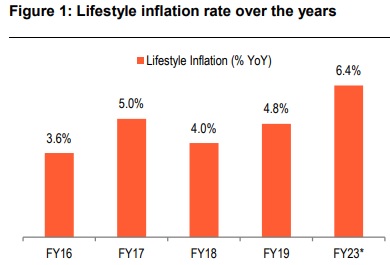
Lifestyle inflation rate seen moving up
How lifestyle inflation has evolved over the years? From FY18 onwards there has been an uptick in lifestyle inflation rate. From 4% in FY18, it has inched up to 6.4% in FY23. Importantly during the same period per capita Gross National disposable income had a CAGR of 8.5%. Even RBI’s policy was also supportive and an easing cycle prevailed in most of the occasions to stimulate the demand conditions. In FY23, 34 out of total 69 items of lifestyle inflation have recorded inflation rate of above 6% with inflation in items such as biscuits, chocolates, Bajra, headwear, belts, ties, leather boots, monthly maintenance charges and new releases for cinema on a normal day remaining in double digits. For certain items, post pandemic impact of higher mobility also got reflected in the increased demand for these items, which resulted in higher inflation rate.
Consumer preferences have changed:
We can compare two time periods i.e. FY18 and FY23 and see for which lifestyle products inflation has noticed a considerable changes. For example, inflation of glassware within the utensils component have noticed quite a bit of change; from 2.8% in FY18, inflation has picked up to 6% in FY23. For candles as well, inflation inched up to 7.1% in FY23 from 3.1% in FY18. Same goes for monthly maintenance charges, where inflation picked up to 10.9% from 2.2% during the same period. The same holds for motor cars and jeeps (2.4% to 7.7%). For electronic items, mobile handsets have witnessed quite a bit of jump, from 0.3% in FY18, inflation in this category went up to 5.9%, for PC/ laptop it went up from 1.6% to 9.1%. in case of clock/Watches inflation went up to 7.9% from 4.9%. Inflation for travel goods picked up from 1.1% to 3.8%. Overall the trend reflects impact of rising affordability and desire of improved living conditions. The Apr-Jan (10 month cumulative data) shows some softening of lifestyle inflation in line with softening of overall core inflation. More than 68% of the miscellaneous category of items have noted softening of inflation, with considerable softening visible for internet expenses, air fare and monthly maintenance charges.
Comparison of Lifestyle Index with Essential Index:
To get an idea about how inflation of lifestyle commodities has evolved in comparison to essential commodities, we have juxtaposed the two. The essential commodities index (ECI) incorporates the 22 commodities which is tracked by the Price Monitoring Division of Department of Consumer Affairs as essential commodities. The equivalent CPI index of the same is used for the construction of the essential commodities index. This has a weight of 22.5% in the overall CPI basket. Here one thing which clearly gets reflected is that inflation of essential commodities has witnessed quite a bit of volatility and in the recent episodes from FY19 onwards the pick-up is considerable. No doubt that is reflected in the policy response of RBI which went for considerable tightening. LII has witnessed higher inflation compared with the ECI in 3 of the 6 years. The 10 month cumulative data reflects moderation in LII at a faster pace compared to ECI. Price increase of essential commodities is more of a supply driven phenomenon, thus more targeted government intervention is necessary to check the same.
Conclusion:
An attempt has been made to construct the lifestyle inflation index from disaggregated CPI data. This index is a reflection of different preferential choices of consumers within food, clothing and miscellaneous category, particularly reflecting lifestyle choices as one moves up the consumption ladder. However, a lot of factors come such as the snob and Veblen effects come into play while speaking of lifestyle products. For now, we only limit our study to capture the demand side on the basis of inflation rates of these items. One thing which clearly gets reflected in the analysis is that, lifestyle inflation has picked pace partly due to demand factor reflecting rising aspirations. However, when the lifestyle basket is compared with essential commodities there happens to be bit of a disparity, as for the latter volatility in food prices has led to a higher inflationary burden compared to the latter.
(Disclaimer The views expressed in this research note are personal views of the author(s) and do not necessarily reflect the views of Bank of Baroda. Nothing contained in this publication shall constitute or be deemed to constitute an offer to sell/ purchase or as an invitation or solicitation to do so for any securities of any entity. Bank of Baroda Group or its officers, employees, personnel, directors may be associated in a commercial or personal capacity or may have a commercial interest including as proprietary traders in or with the securities and/ or companies or issues or matters as contained in this publication and such commercial capacity or interest whether or not differing with or conflicting with this publication, shall not make or render Bank of Baroda Group liable in any manner whatsoever & Bank of Baroda Group or any of its officers, employees, personnel, directors shall not be liable for any loss, damage, liability whatsoever for any direct or indirect loss arising from the use or access of any information that may be displayed in this publication from time to time.)