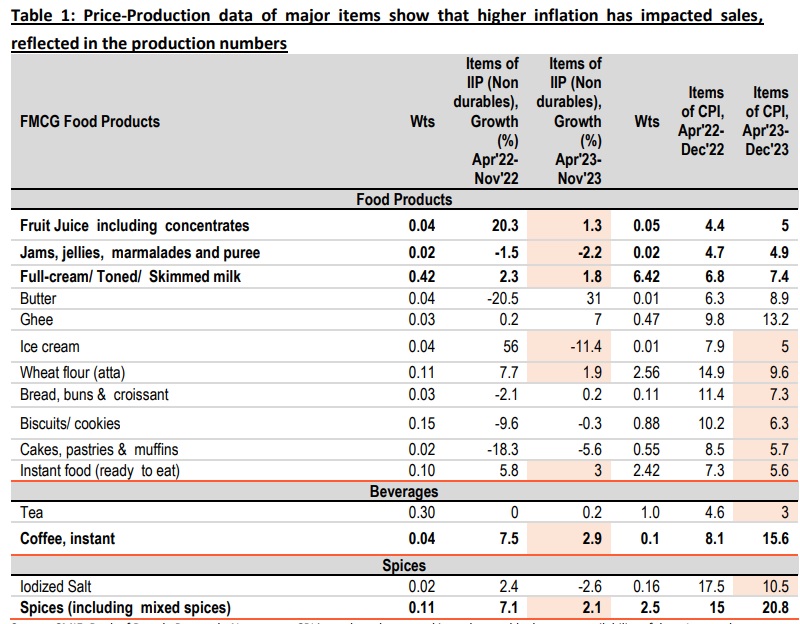
The fall in production is more pronounced for fruit Juice including concentrates, chocolate & cocoa powder, spices, coffee, jams, jellies, marmalades and skimmed milk
Dipanwita Mazumdar
Economist,
Bank of Baroda
Mumbai, January 31, 2024: A lot of talks are ongoing about the consumption picture of Indian economy. Broadly indicators of private consumption demand have painted a mixed picture. Retail credit has remained firm while some moderation in services activity such as PMI data, air passenger and passenger vehicle sales data, have shown that pent up demand phenomenon is slowing down. The core inflation data, especially core services, which also captures the consumption demand has softened considerably. As per our calculation, ‘core services’ inflation is trailing below 4% for the past three months (currently at 3.6%). Thus, we have looked at the production and price angle for both non-durables/FMCG and durable consumer goods segments. For the production angle, cumulative growth rate of IIP for Apr-Nov period is compared with same period of previous year. Production is taken to be synonymous with consumption as data on the latter is not separately available. For the price picture, disaggregated data of CPI has been used. Notably for CPI, the cumulative growth rate is for Apr-Dec period and for IIP the corresponding is for Apr-Nov period, as IIP comes with a lag of one month. But nevertheless, it gives a broad idea, and the one month lag of IIP is ignored in this analysis.
Key highlights:
· For consumer durables, the pent up demand phenomenon for major white goods has gotten diluted, which have impacted their production.
· However, moderation in production of certain items such as essential wear, passenger cars and some daily items of household consumption such as hair oil, tooth paste, despite moderation in inflation reflect certain degree of strain on the underlying demand conditions.
Section 1. FMCG segment:
Here two things clearly emerge: 1) for certain food products, higher inflation has impacted sales, reflected in lower production data, 2) for certain daily items of household consumption, production has fallen despite softening of inflation, reflecting strain in demand conditions. Amongst food products, except butter and ghee, the growth in all segments is trailing behind last year. The fall in production is more pronounced for fruit Juice including concentrates, chocolate & cocoa powder, spices, coffee, jams, jellies, marmalades and skimmed milk. It can be said that higher inflation in these categories has impacted demand for these products, which in turn was reflected in their moderation in production. However for other items such as Breads, buns, croissants, biscuits, cakes and other bakery products, both price and production have been lower. However price inflation is still high at above 5% across the board and hence have witnessed higher increase in prices for the second successive year. These are processed food items, thus increase in prices is attributed to elevated prices of wheat and maida which goes into the making of these products.
For miscellaneous items, different price production picture emerges. For toothpaste and hair oil, increase in production is line with falling inflation, as well as a negative base effect. In addition to this, demand for items such as shampoo, creams and lotions which may be a discretionary spending for certain categories of consumer, have witnessed fall in production even with inflation easing. This is indicative of households reallocating their expenditures and moving more to essential goods. Detergent soaps are essential and have witnessed high inflation of 6.1% even though lower than last year. Hence demand has been relatively more positive.
In case of sin goods inflation has been relatively low at between 2-3.2%. Growth in wine consumption has increased which could be reflective of changing consumer tastes. Beer production growth was low at 3.8% over a very high base of 2022. The same holds for cigarettes though it is possible that health concerns may have slowed down demand. However, it needs to be seen if such a pattern continues for a longer period of time before the conclusion can be validated.
Section 2. Durables segment:
Here one interesting thing which is seen from the table is that for certain items the pent up demand phenomenon is slowly fading. This is seen for items such as refrigerators, travel goods, watches, AC, mobile and computers. For most products growth in 2022 was very high which has moderated or declined in 2023. The fall in production of computers may also be due to return to work rather than work from home phenomenon which was seen during the Covid period. The fall in production of passenger cars despite moderation in prices, somehow hints at moderation in purchasing power. Even fall in production of essential wear despite moderation in prices also reflect some strain in demand conditions. Inflation too has played a role with rates being above 5% for most products. Interestingly in 2022 higher inflation did not come in the way of demand as households increased consumption due to the limited access to such products during the pandemic.
Another side of the durable goods data, is pick up in production of items such as ceiling fan, bicycle. The first hints at pickup in real estate activity, which is noteworthy. Inflation has also moderated for 5 all these items, which in turn supported demand. However the same is not witnessed in case of TV sets where growth in production is marginal after falling in 2022. Here it can be attributed to changing tastes of consumers as people have switched over to watching OTT programmes on laptops and mobile phones thus obviating the need to have a TV set at home. Therefore even though inflation was marginally negative, it did not lead to an increase in production.
Section 3. Price Production matrix:
In this exercise, we examine how the price-production dynamics of consumer goods-FMCG and durable goods segment have panned out in totality. The last two sections have given us a disaggregated picture, where some bit of lost momentum was observed in case of demand for durable goods. The matrix is an attempt to consolidate the same and arrive at a conclusion. Here also we get the same conclusion, for FMCG segment, the matrix is more distributed, with 29% of the items noting fall in production and the corresponding increase in price level, clearly reflecting the price-production relationship. However, here also demand story shows some bit of strain as 27% of items are noting both fall in production as well as fall in prices.
The matrix of durable goods comes as a pretty conclusive one, as 63% of durable goods items have registered both fall in production and fall in prices. Thus, this part of consumption demand has been impacted due to fading pent up demand phenomenon.
(Disclaimer The views expressed in this research note are personal views of the author(s) and do not necessarily reflect the views of Bank of Baroda. Nothing contained in this publication shall constitute or be deemed to constitute an offer to sell/ purchase or as an invitation or solicitation to do so for any securities of any entity. Bank of Baroda Group or its officers, employees, personnel, directors may be associated in a commercial or personal capacity or may have a commercial interest including as proprietary traders in or with the securities and/ or companies or issues or matters as contained in this publication and such commercial capacity or interest whether or not differing with or conflicting with this publication, shall not make or render Bank of Baroda Group liable in any manner whatsoever.)