Despite many structural changes, PSBs are operating at 82.76% and in overall study period, pvt banks operating below 80% level; “Impact of Decadal Reforms on Efficiency and Productivity of Indian Banking Sector: A DEA Approach”
FinTech BizNews Service
Mumbai, June 17, 2024: The Economic Department of State Bank of India has come out with a Special Research Report titled – “Impact of Decadal Reforms on Efficiency and Productivity of Indian Banking Sector - A DEA Approach”. The report has been authored by Dr. Soumya Kanti Ghosh, Group Chief Economic Adviser, State Bank of India,
In the last decade, the Indian banking system has exhibited resilience and surpassed many challenges arising from both domestic and global economic environment.
❑ The improvement in asset quality was primarily led by strong macroeconomic fundamentals and effective regulatory and supervisory oversight, mainly focusing on creating a level playing field, creation of strong banks through mergers and capital infusion, improving governance practices expanding the reach and quality of financial services, and enhancing the adoption of digital banking while ensuring customer interests were protected and most importantly ensuring that financial sector was well-cushioned with capital and liquidity buffers during the pandemic.
❑ In this context, the paper aims to find the impact of the decadal regulatory measures on efficiency and productivity of banks in India by employing the non-parametric approach of data envelopment analysis for 2005–06 to 2022–23.
❑ To isolate the productivity change over the years, the Malmquist Productivity Index is further decomposed into technological change and efficiency change to see the overall productivity over the years. ❑ The results show that contrary to popular perceptions, the performance of PSBs are much better compared to private and foreign banks
• The estimated results indicate that during the sample period starting from FY06 till FY23, the overall banking industry operated at 81.21% level, i.e., inputs could have been reduced by 18.79% for producing the same level of output. The bank group wise results for FY06-FY23 indicate that contrary to popular perceptions, PSBs are the leader and operating at 82.76%, Pvt Banks are operating at 79.59% and FBs are at 78.15%. The overall productivity for the period has witnessed an increase of around 6% in the TFP growth, which is primarily due to higher efficiency change and lower change in technological progress.
Indian Banking sector is hail and hearty
Credit cards, now totaling 10.1 million in numbers have average outstanding of Rs26,000 (Jan’24) with rollovers/revolvers in check….This pales in comparison to total card O/S of US$1.13 billion for the 167 million US card holders, increasingly under default pressure as interest rates have risen fast.
❑ India’s stock markets growth sojourn has been underpinned by an overwhelming proportion of domestic investors (150 million plus now) who are increasingly bolstered by the proven wealth creation proposition ingrained by equities in the long run…Interestingly, here too, regulator is shunning the risky derivatives-style assets to average unseasoned investors through a mix of financial / behavioral dictums, nudging them to invest, and not speculate!
❑ Globally, the size of the non-bank financial intermediation (NBFI) sector declined by 3% in 2022, which is the first notable decrease since 2009 (FSB Global Monitoring Report on Non-Bank Financial Intermediation’2023). However, Economic Function 2 (EF2) entities i.e., entities undertaking lending activities, which are akin to NBFCs in India, exhibited a growth of around 10% which is the highest among all five economic categories of the NBFI sector monitored by the FSB. India thus accounts for third largest share of EF2 assets after the US and the UK is thus not an exception to the global trend…
❑ The household sector post pandemic jolt moved towards physical assets over financial assets and has now again started to move towards financial assets in sync with a young age that is becoming more attuned to wealth creation, duly enabled by emergence of India’s DPI (Digital Public Infrastructure) fanning a global partnership, spanning both DMs as also EMs along financial innovation that impact ease of living the MOST.
Perspective on Indian Banking: Policy Reforms & Growth
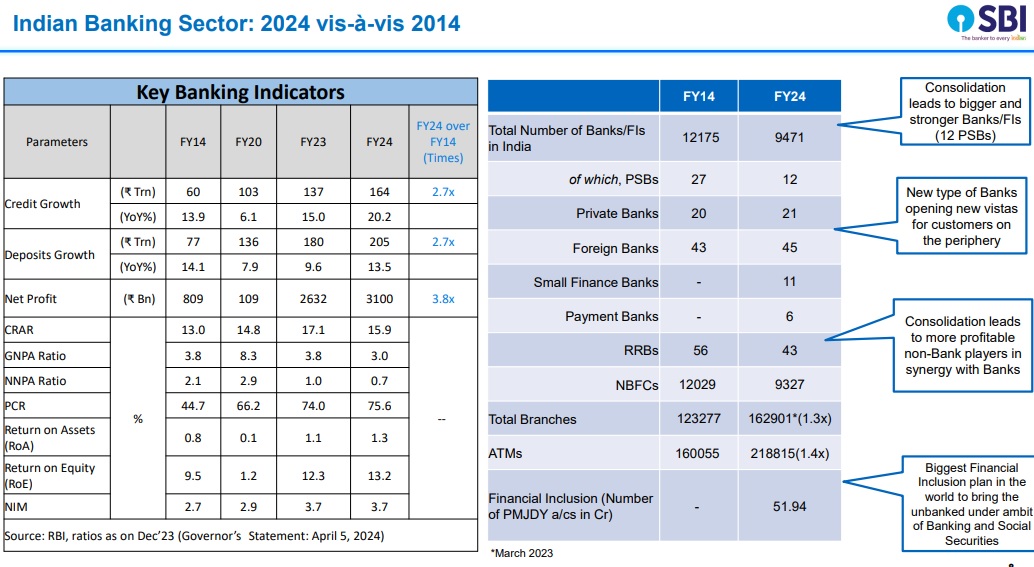
5th Generation Reforms have been undertaken from 2014 Onward to serve as enablers in Amrit Kal PSBs holds > 50% of Banking Business, Branches & ATMs. Indian Banking Sector remains adequately capitalized & comparable to developed economies. GNPA ratio of SCBs ratio declining to 3.0% in December 2023. Asset quality improved across all the major sectors
❑ Macro stress tests for credit risk reveal that SCBs would be able to comply with the minimum capital requirements even under severe stress scenarios. The system-level CRAR in September 2023, under baseline, medium and severe stress scenarios, is projected at 14.9%, 14.0% and 13.1%, respectively.
Shift from Traditional Banking to Digital Banking
Increased use of Smartphones in delivering banking services: Smartphone users expected to reach 1 billion by 2026.
❑ Internet users increased from merely 250 million in 2014 to 1 billion in 2022 and expected to reach 1.5 billion by 2037.
❑ UPI based payments model: expected to touch 500 million by end of 2024 (250 million as of now)
❑ Zero or minimum hops between customers’ aspirations and delivery of services/goods
❑ A ‘Digital Bank’ within the Bank: Embedded Finance, Delivery of credit through PAPL products and robust fraud management.
Outlook
❑ Move towards Open Banking
❑ Leveraging AI & Analytical Capabilities for delivering/offering various financial & non-financial products
❑ ONDC is expected to bring revolution in promotion of e-commerce….benefitting medium/small sellers primarily
❑ Cloud will be the single biggest banking technology…branches too will metamorphose into a virtual experience center!
Challenges
❑ Banks to re-orient their staff and culture towards “Digital-first” mindset ❑ Cost and Infra Management through digital Channels ❑ Sustainable Skillsets ❑ Cybersecurity & Online Frauds
Why is Measuring Efficiency Required?
❑ There has been a policy shift toward consolidation of PSBs to create strong and efficient banks to support economic growth in the country in the last
❑ This motivates one to check the efficiency & productivity of banks in India
❑ We will address the following questions
• How efficient are banks in India?
• Does efficiency increased productivity of the banks? ❑ A bank is considered as efficient if there is no way it can produce more outputs with the given level of the inputs or vice-versa. Economic efficiency of a Bank comprises
• Technical Efficiency (TE) = Pure Technical Efficiency (PTE) x Scale Efficiency (SE)
In order to compare the technical efficiency score and productivity change, we summarise the values of both TE and its components and MPI and its components.
To measure TE of banks, there are several techniques, by using data envelopment analysis (DEA), stochastic frontier approaches (SFA) and financial ratio analysis. We use DEA technique in our Mode.
Data
The study considers period between 2006-07 to 2022-23 (16-Years), which includes 3-major crisis, global financial crisis in 2008, asset quality issues in banking sector following recognition of NPA and finally COVID-19 pandemic in 2020 faced by the banking industry
❑ The sample consists of 43 banks (12-PSBs, 19 PVT Banks and 12-FBs) listed in appendix, having operations consistently in all the years of the sample period 2005-06 to 2022-23 (18 years).
As many banks were merged during the study period, the earlier year’s data were merged to have a better comparison. The selected 43 banks for our study cover 96.5% of the assets of the banking system. The selected 12-FBs cover more than 80% of the assets of the total foreign banks in India.
Empirical Results: Efficiency Change
❑ The estimated results indicate that the mean technical efficiency of the sample banks was at 91.72% in FY06 and increased to 93.9% in FY10 but declined thereafter to below 90% during FY11-14. However, it started to increase in FY17 & FY18 but declined there after till FY21, may be due to COVID-19 pandemic. While the TE index is now improving with the increase in banking business.
❑ However, if we look the full sample period starting from FY06 to FY23, the overall banking industry operates at 81.21% level, i.e., inputs can be reduced by 18.79% corresponding to the same level of output.
PSBs are better efficient than private banks except FY19-23, which may be due to merger and rationalisation of business, branches, and employees.
• Despite many structural changes, PSBs are operating at 82.76%, compared to ASCB at 81.21%.
• SBI has remained efficient and better than all the bank group in all the 4-study period
• In overall study period, pvt banks operating below 80% level, which is primarily due to DCB Bank and IDFC First Bank. It seems takeover of weaker banks affected the efficiency in private sector.
Efficiency Change of Individual Banks
In relative performance of individual banks, among PSBs, SBI performs relatively better and scored 97.88% during the full sample period FY06-FY23, followed by UBI at 92.53%
❑ Among the private banks, HDFC bank has scored 97.96% followed by Axis Bank at 94.43%.
❑ Among foreign banks, JP Morgan has scored 1, followed by HSBC Bank at 98.45% TE.
❑ As we followed input-oriented model, so there is a need to cut down their inputs to produce the same level of output, which can be done through budget benchmarks, cost rationalisation etc. The minimum and maximum numbers indicate that there is a divergence in TE among banks.
Results from Malmquist Productivity Index
The change in Malmquist total factor productivity index is the product of catch-up and frontier-shift effects
❑ The TFP change of the entire period FY06 to FY23 is 4.04% (Score: 1.0404), which is contributed by an improvement in efficiency change (catch up) of 3.2 % (Score: 1.0322) and technological change (frontier shift) of 1% (Score: 1.0100)
❑ The bank-wise MPI indicates a mixed result. The PSBs MPI index has improved to 1.0235 in FY12-13 from 0.8498 in FY06-07 but declined thereafter to 0.8868 in FY15-16 and then gained the efficiency to reach 1.0508 in FY21-22 but declined in FY23 due to the decline in frontier shift efficiency numbers. While private banks maintain above 1 MPI scores till FY20-21 due to the technological innovations but declined thereafter to 0.4199 in FY23.
Comparison of Efficiency and Productivity
• The technical efficiency of the sample of 43 banks indicates that efficiency of the banks has declined from 0.9284 in 2006-07 to 0.7637 in 2019-20 but improved thereafter. Similarly, the MPI index also seen declining from 1.2218 in 2006-07 to 0.8930 in 2015-16 but improve thereafter to 1.6841 in 2021-22. However, it declined in 2022-23, due to the decline in catch-up efficiency scores. • For PSBs both technical efficiency and MPI score has improved over the years. While for both private sector and foreign banks, both efficiency and productivity has declined significantly during the study period