Deposits and credit expected to grow 14.5-15% and 16.0-16.5% respectively in FY25
Dr. Soumya Kanti Ghosh,
Group Chief Economic Adviser,
State Bank of India
Mumbai, April 2, 2024: The Economic Department of State Bank of India has come out with the Special Research Report titled – ‘Prelude to MPC Meeting: April 3-5, 2024’.
India a notable exception to strong evidence of Emerging Economy Central Bank rate actions being predicated by Advanced Economy Central Bank rate actions …Structural shifts underway in US markets with coexistence of low unemployment rate coupled with elevated job vacancy rate…inflation is currently being driven by food price dynamics… We expect deposits and credit may grow 14.5-15% and 16.0-16.5% respectively in FY25…. RBI might cut rates only in Q3FY25.
The US monetary policy tightening seems to have achieved its objective of anchoring the short-term inflation expectations as the latest monetary policy report indicates cooling of inflation expectations; 2.1%-2.8% in 2024, 1.9%-2.6% in 2025 and 1.9%-2.4% in 2026. Thus, current short term inflation expectations are clearly anchoring to the target Fed inflation rate of 2%.
❑ The scatter plot between US inflation and unemployment (the Phillips Curve) shows that for all sub periods, the long run Phillips curve is tracing the 100-year average range of 4.5-5.5%. The long-term expectation on unemployment in the recent monetary policy report is 3.4-4.3%. Current unemployment shows tight labor markets with reference to long term trends.
❑ The slope of the short Phillips curve is varying, nonetheless steepening in 2023 indicating that any unexpected deviation in inflation expectations can be controlled without much cost. Thus, it appears Fed will retain its 2% inflation rule for the time being given the steepening of Philips curve.
❑ Interestingly, the US labour market seems to have embraced two contrasting trends simultaneously: a low unemployment rate coupled with elevated job vacancy rate…Ideally, fighting inflation would have resulted in an unemployment rate and a decline in vacancies, but that continuously eludes the US job market…in particular, structural shifts in the US labour market through a Markov switching regime (US Unemployment and Job Vacancy rate through Jan’18 to Jan’24) reveals low unemployment rate and elevated job vacancy rate….will now last longer till the end of 2025…..
❑ The mercurial rise of gold has entered a new, somewhat uncharted zone in terms of price as also demand…the Central Banks seem to fan the demand, their appetite for this precious metal exceeding net demand in excess of 1000 ton for two years in a row….. World Gold Council latest data shows cumulative holding of the Central Banks in yellow metal reaching a record 7,800 tonne as on end Dec’23 (6,671 ton as on end’22) as they bought 1,037 ton of gold in the year 2023, a little low from 2022 high of 1,082 ton. Global official sector gold reserves are now estimated to total 36,700 ton…Gold clearly, appears to have more headroom.
To test the hypothesis of future values of emerging economy rates being influenced by past values of advanced economy rates, granger causality tests, involving the data from Jan 2008 to Mar 2024 shows that all major emerging economies rates such as of Indonesia, India, Malaysia, Saudi Arabia, Thailand are either being predicted by past movements of US rates or UK rates, signifying granger causality relationship…
Lag of 2 months is found to be optimal lag of operation in the interplay of these rates across countries….RBI might cut rates only in Q3FY25.
❑ Back home, With moderate fuel prices, inflation is currently being driven by food price dynamics. CPI inflation is mostly driven by good inflation. Looking ahead evolving food prices will determine domestic inflation. CPI inflation is expected to remain slightly above 5.0% in the remaining month of FY24. Core CPI declined to 3.37% - a 52-months low
❑ Inflation is expected to decline till Jul’24 but increase thereafter to reach a peak of 5.4% in Sep’24, followed by a deceleration. For the whole FY25, CPI inflation is likely to average to 4.5% (FY24: 5.4%)
❑ Liquidity deficit has declined since the last policy in Feb’24. Net LAF has remained in the deficit mode since mid-Sep’23, with average of Rs 0.97 lakh crore post Feb’24 policy….. Government surplus cash balances have declined to an average of Rs 1.18 lakh crore post Feb’24 policy…Durable/core liquidity surplus has come down to Rs 1.87 lakh crore. However, the impending JIT mechanism will keep the Government cash balances elevated going forward…while this could have an adverse impact on liquidity, the spectre of capital flows in FY25 could pose challenges and opportunities for RBI liquidity management…
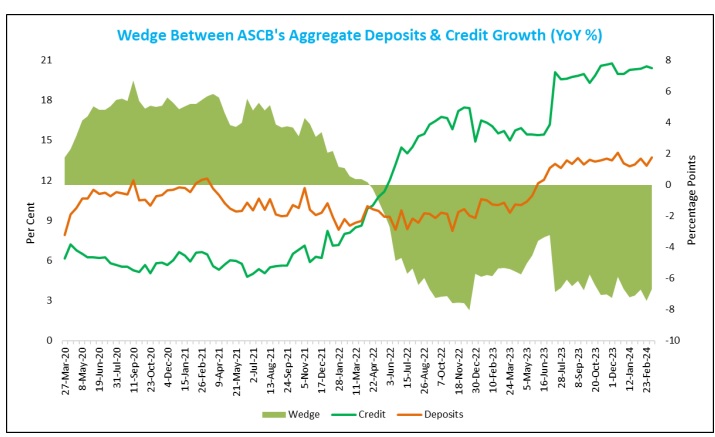
On the banking front, deposit growth has rebounded but sustained credit growth momentum has increased wedge between deposits and credit growth…As on 08 Marc, ASCBs credit grew by 20.41% (15.7% last Year) and deposits by 13.7% (10.3% last year). Latest credit growth numbers reveal a sustained pick up across Agriculture, MSME & Services… We expect deposits and credit may grow 14.5-15% and 16.0-16.5% respectively in FY25.
❑ India has beaten rest of the Asian markets by attracting the highest foreign funds flow in March, defying geopolitical crises and concerns that the higher interest rate regime will continue for some more time. ❑ Equity inflows comprises of 80% of total inflows as of now but going forward we believe the debt inflows can pick up big time as passive investments in bonds under FAR route start trickling for both JP Morgan as also Bloomberg index investors…the $30-35 billion estimated investments can help in cooling the yields on benchmark securities (reducing the borrowing costs) though exchange rates can witness some volatility.